28 February 2011

Seasonal Effect : March


February is about to end, with the last trading day as the most important event day from policy perspective. As the entire finance bill gets digested, real trend will emerge not on the budget day but later in the next month.

So what has March looked in terms of historical returns?

As the chart says, apart from 2008, post budget months have been generally good in recent times.

But another important thing to note is that generally March has been an opposite return month. The years highlighted in green are those which saw this phenomena, and they are far too many to be ignored. All last four years have seen this happen. Looks like budget is a key reversal event! Nifty ended Jan around 5500, if we don't get a 200 point rally tomorrow (chances are we wont!) we will be ending Feb down, so expectation of a March closing with gains would be higher!

Nothing great can be pointed out from the Top chart except that March generally starts strong, shows weakness after first week and then again pick up steam in later part of the month.

How will March 2011 treat Nifty will finally depend on how local and global cues are.
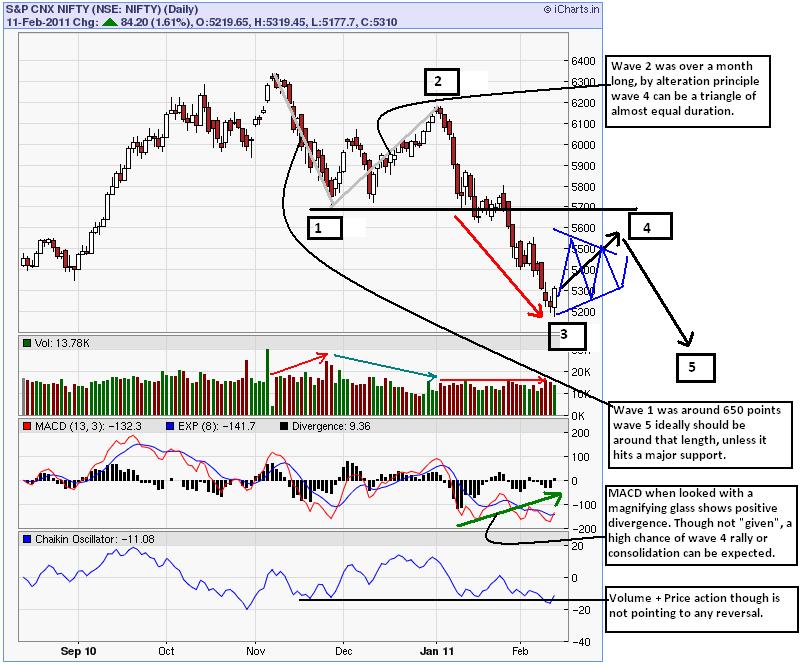
Nifty is clearly weak and any bad news can weaken it more.
Though the supports are near and strong, but the breach of them will create panics galore!


26 February 2011

Breadth Indicator : Week Ending 25 Feb 2011


The expiry day sell off really crushed the hopes of any budget rally. Apart from hopes the breadth of the market was also dashed. The chart above is for March series, showing that a huge majority of stocks that are traded under the March expiry date are closer to their lower end of trading band.

Its too early to comment on where this series will go as it is a long and very eventful one. But surely the back of the bull has been broken and it will take some time for confidence to come back. The expiry day selling shows that there is hardly any long rollover, the bulls can at max hope for some consolidation and confidence building.

The pessimism in the market will surely not allow steep fall easily, so expect sideways movement between 5180 and 5500 for some more time.

19 February 2011

Max Pain : February Series


13 February 2011

Nifty : Bearish Motive Wave?


Nifty Vs S&P 500

As discussed earlier in Nifty's Decoupling I was expecting Nifty Vs S&P 500 ratio to first slide to 50 week moving average and then to 200 week moving average. It looks like I am going to get more than I bargained for!


In the chart above you can see the ratio has almost from almost 5.4 to 4 a drop of 25% which is kind of huge. Whatever happened to the darling of emerging market consumer driven growth story. One thing is as true as the sunshine, that nothing can ever escape mean reversion, equities for that matter can never!

So what happened here. Was the valuation getting too far ahead, did the scams and scandals broke the faith, is the Inflation really going to dent the earnings, are we in for a series of rate hike due to inflation worries or there is some bad news going to come up, already priced in. Whatever be the reason, its for sure that emerging markets are really going to have a tough time now that developed markets are surrounded by extreme bullish sentiments. Money is now flowing back home! My contrarian senses are telling me that very soon the US and European markets will also see a turn of tide, and if that happens emerging markets will have no place to hide.

Coming back to the chart, a correction of around 10% to 15% in S&P500 will take it to around 1200, which will correspond to 4800 in Nifty as per long term ratio. I am well prepared to see levels below 5000 in as early as March.

Breadth Indicator : Week Ending 11 Feb 2011


There has been significant improvement of breadth, when compared to distance away from lows. Thanks to short covering on Friday, Nifty also managed to close above 5300. This rally is coming from very oversold levels so higher levels can be expected.

In terms of breadth, for any rally to be significant check for the peak of this chart to be made around 0%. Till then majority is still underwater and the process of lightening the portfolio can start anytime soon. 140 stocks out of 200 odd are trading in the band of -80% to -50%, this market has been virtually killed by the FIIs. The direction of the market will be governed by the "Shorts" for some time to come. It would be interesting to see if they are in weak hands.

Trading advice would be not to long stocks that are flying in the short covering rallies which I expect next week.

12 February 2011

Nifty : TRIN view


Nifty : Consolidation Coming?


06 February 2011

Nifty : Weekly Chart Check

After the fast fall of Nifty since the start of the year, the weekly chart has become very interesting as there are many crucial levels that have been broken. Without delay lets dive into the chart:


The most basic and evident technical setup to be pointed out should be the break of the trend line starting from 2500s Nifty lows. It gave support to Nifty during the November fall, but gave way in January. This factor itself should give jitters to many long term investors.

Second point to note is the 50 week moving average being broken. As of now it is around 5550 area, but has been tested from below and acted as resistance. The break of 50 week average, comes with an expectation of test of 100 week average which is around 5000 levels.

Third and final setup is the Ichimoku Cloud giving a "weak" sell signal [marked as A in chart]. Also see that this kind of "weak" buy signal was generated last in March 2009! We have cloud support at 5000 to 5200 area, and we should expect some sort of buying emerging here. Very interesting to note here is how price is trying to target the cloud where it is thinnest.

So in all I would be expecting Nifty to be in a downward trajectory unless any of these supports provide strong buying reason. Look out bulls, the game is never over...

05 February 2011

Breadth Indicator : Week Ending 04 Feb 2011


Again Nifty ignored the global cues to close down for the week. The seriousness of the fall in Nifty and the mass exodus of investors (esp foreign) can be measured by the fact that, YTD India is 2nd worst market globally. And guess who is the worst, yes you are right, its Egypt!

Coming to the breadth, few laggards have degraded themselves to -100%, though there is no material difference as compared to last week. "Strength Index" an oscillator of the market breadth prepared by yours truly has just dipped a tad from -62% to -63%.

Though the Nifty dipped around 125 point this week the breadth is still holding on. We can expect tight range trading with negative bias, due to strong supports in 5300s. 5350 broken convincingly should start another bout of strong selling.