31 October 2009

Nifty : 4700 revisited

Severe correction has gripped markets all over the world. India has been weaker than some of its Asian peers. Is it the end of the rally? Take a look at the chart.


4690-4730 was a tough nut to crack for Nifty and it took 4 attempts to break it convincingly. According to classical technicals this should act as a support on the way down. The way Nifty has been cutting through moving averages it seems only a level support can come for rescue. But even if this fails (while I write US markets are down by over 2%) some kind of "Black Tuesday" awaits us. Monday is a day off (thankfully!).

Bull Case from now on would depend on, when do we get a bounce from these oversold levels. A bounce too little too late would definitely break the back of all bulls.

I recently came across some article which suggested overlapping of 4th wave and 1st wave (for a small period of time) can be expected in Diagonals. I need to get some more confirmation on it. But whatever be the case the equity markets are very precariously poised at the moment.

28 October 2009

Nifty : Relief Rally and Consolidation

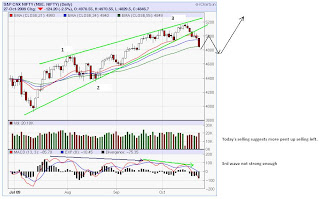
After today's record selling, which made Nifty reach its target of 4860 (read previous post); many fears have crept in. This may not be the end of correction and we can see lower levels after some rally from oversold levels. Lets analyze why this correction came and how will we get out of it...


I have marked in green the rising wedge pattern, a very strong bearish indication along with negative divergence (also seen in green at MACD). Rising wedge patterns generally mark the end of a 5 wave structure. So strong corrections are expected once the wedge is broken. We saw it breaking on Oct. 22, first sign of things turning for the worse. The other aspect that supported a correction was the closing below 21Day EMA on the same day. (21Day EMA, is considered the make or break level by a bulk of swing traders). Other not so technical reason, being Telecom sector totally breaking down. We do see some weak sectors cracking earlier than the Index.

I have been pointing that the 5 wave structure that I am following from 3919 lows, suggests that we are in the 3rd wave from the 4353 lows of Aug. 19, which ideally is supposed to be the strongest wave. But looking at the MACD (blue arrow) of the 3rd wave, we don't see any new momentum high, that is momentum corresponding to 3rd wave is lower than 1st wave. This indicates that we will end up in the lower part of the band of the projected 3rd wave targets.

And that's exactly what happened, the minimum target of 5165 was overshot by mere 17 points. The other danger of this poor show by 3rd wave is that we can have a deep 4th wave, which otherwise would have been quite flat. So the 4th wave correction may take us to the lower end of the projected target (4865-4760).

Now let us focus on how the correction may look like. The alteration principle says that we may have a flat or triangle correction as the 2nd wave was a zigzag! There are higher chances of Nifty being in a 4800-5000 range for quite some time, with a rectangular or triangular pattern formation. But we should not totally rule out a swift zigzag correction as well.

Whatever be the correction pattern, we should look for two major factors, selling is slowing (positive divergence in MACD) and this correction not going below 4730 (end of 1st wave).

My gut feel is that we should see some relief rally from these oversold levels and then consolidate in a range. As I still feel there is another bout of buying left, I would presume that this range would finally frustrate the buyers and they will give in to their urge. We should see Nifty over 5250 when the 5th wave ends.

25 October 2009

Crude Oil : Nearing a Top

Lets have a look at the Crude Oil daily chart. After its steep fall from nearly $150 to $35 one of the Hottest Commodity have made another swift rise to above $80. I have labelled the rally from $35 till now as per EWT. What we see is that wave1 was 20 in length and wave3 was 28. So as per theory we can expect wave5 to reach a maximum of 28+65= 93. The minimum target of $77 has already been achieved and $85 which is an ideal target is not too far.


The other thing to note is that 50% retracement of the entire fall from $147 to $35 is at $91. Which gives us another reason to expect crude to face heavy weather in the coming days if it keeps on rallying.

Dollar Index too is showing signs of bottoming in near term, the prime reason for the Crude Oil's latest upmove.

So the 3 targets to keep in mind if you are an Oil trader are 85, 91 and 93.
Above 93 the wave count stands violated.

18 October 2009

Bob Prechter : A scary world is perfect for stocks, and a perfect world is scary for stocks.


This alternating current of ebullience and conservatism goes back to the most basic Elliott wave idea: Bull markets give way to bear markets, and vice versa. What are the essential ways in which bear market moods differ from those of bull markets?
 
Bob Prechter: In bull markets, people focus on progress and production; in bear markets, they focus on limits and conservation.
 
O.K., I can see that. What else?
 
Bob Prechter: Bull markets result in increased harmony in every aspect of society, including the moral, religious, racial, national, regional, social, financial, political and otherwise. Bear markets bring polarization. With that realization, you can predict increasing cooperation in all those areas in bull markets, and increasing conflict in bear markets.
 
It's hard to imagine turning bearish when peace breaks out all over or turning bullish on society in the depths of scary times.
 
Bob Prechter: A scary world is perfect for stocks, and a perfect world is scary for stocks. When the world appears perfect, most investors have their money in the market, and there is little or no buying power left to fuel the uptrend and nowhere to go but down. When it appears scary, stocks are cheap and hold huge upside potential.
 
So people get it backwards.
 
Bob Prechter: Exactly, people consider these to be the events that shape their futures, but they only reflect the past trend of social mood.
 
What is it that people are unprepared for now?
 
Bob Prechter: The bear market will bring back nationalism, racial exclusion, and perhaps even religious conflict. Thinking technically about events, that is, observing what they reveal about social psychology, prepares you for those changes, whereas trying to predict the future from the events themselves leads you to the opposite, and wrong, conclusion. It cannot be stressed enough, because life-or-death decisions can depend upon your assessment. Notice what marks the major bear-market lows of just the last 200 years – the Revolutionary War, the Civil War and World War II. Those were buying opportunities.

Mahurat Day : Minimum Nifty Target Achieved

Nifty reached 5175 momentarily and as per Elliot counts, the minimum target has been attained. (read previous post). Though Nifty opened strong it lost all the gains and closed flat. Nothing in the horizon can be seen to announce the end of the uptrend in the short term and we should hardly make anything out of the 1 hour token trading where institutions are absent. But how many times do we see anything "happen" to break the trend.

As per my opinion we can go higher but the conviction with which I say is lower, and to be honest I will keep my stop loss strict to protect the profits. We should be mentally prepared for correction which can be as deep as 4760.

Here are the levels to watch if we don't go any higher (ideally the target of Wave 3 is 5310).
4985, 4860 and maximum 4760.

I will emphasize that if this short term uptrend is broken here, there are higher chances of a deeper correction (more towards 4800).

17 October 2009

Chambal Fertilizer for a quick buck!


10 October 2009

Nifty : End of correction?

For last few days we are witnessing an awkward situation. The global markets have been supportive and yet since October 1 we are seeing Nifty though opening in green close with moderate losses. We have seen it drift lower from 5111 the high made on Oct 1 to 4935 on Oct 9 with a low of 4921 on Oct 6.

The reason for this correction while other markets move up, remains very much technical. The upward push lost momentum, as new buyers are not keen in buying at such high levels. As the market is not going up, we see profit booking by existing position holders. Inevitably a level will come where the "cash on sidelines" (if there is more of it) will start rushing in and along with it the "momentum chasers" and take the Nifty to newer highs.

As per Elliot waves we are currently in wave 4 correction inside a larger wave 3 (see chart). The wave 4 target as per the theory should be a minimum of 4907 and a maximum of 4844, though the caveat being corrections need not necessarily meet the minimum criteria when the undertone is very bullish.


So we can expect the markets to dip slightly more maybe to 4900 mostly by short selling as there are some negative sentiments developing in India (telecom and IT being the main culprits), but that should be the end of it in my opinion as global markets are showing strength. I feel we should see some bounce from here which I assume will be the start of wave 5, which have to take Nifty above 5111 and a minimum of 5165 and in ideal condition to 5310.

We have not seen strong momentum which is usually associated with third waves (larger count) till now, could this be the blow out, which most "analysts" are talking about or we still need to wait it.. only time will tell.

Last word : the above assumptions and predictions are valid till the correction ends above 4744. But deeper the correction, lower the upside targets discussed.

02 October 2009

S&P 500 : Start of a significant correction ?

Poor economic data have given bulls a shock and all hopes of Dow moving into 5 digits will rest in peace for some more time. Lets take a look into the daily chart of S&P 500 as of October 1st.


The lower trendline was broken though we have not convincingly gone below 21 day EMA. But if we get another down day which is pointed by the futures we will break it. The break from the rising wedge is a strong bearish pattern.

The height of the wedge is 125 points, which should be the minimum target for this leg down, with minor support coming at 975 which is 100 day EMA. If that does not hold we can easily see levels of 925. Which is roughly the target of the rising wedge breakdown. We also see that the index has spent around two months in the range of 875-950, which can act as a support as "value buyers" can get in those levels.

Well only time will tell how severe this correction is going to be. Will the dip get fiercely bought, or it will become a crack.