30 January 2011

Seasonal Effect : February

Earlier I pointed out that February is the most bullish month for Indian Equities, it was a perfect example of how data can be misinterpreted! Lets get deeper into February performance and see why few data points can create a bad factual statement.


Apart from the "Liberalization" budget of 1991 and 1992, the run-up to the budget has been quite moderate, nothing to make an outright statement on the myth of budget rally. Also if you see the 5 period moving average, it has consistently dwindled down and has just slipped into negative. I think in year 2011 also given the global overbought conditions and cautious stance maintained by larger players on Emerging and Indian equities the chance of a runaway rally is quite feeble. Also there is much larger fear of Inflation eating into corporate profits than hopes of a growth oriented budget.


Above is the chart showing the effect of dates on returns, it is hardly showing any pattern except for that it is completely random!

These kinds of seasonal analysis should not be taken seriously, but its always good be in a position to have a small knowledge than nothing at all.

29 January 2011

Breadth Indicator : Week Ending 28 Jan 2011


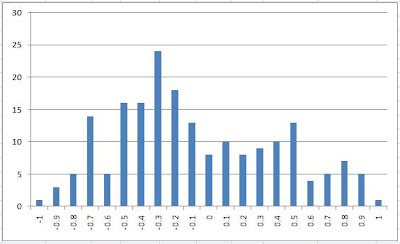
As warned earlier on this topic, breadth was bad last week and it has just got worse. Peak is still at -90% but the size of this peak and the one at -80% are worth looking at! Over 100 stocks out of 200 odd traded in F&O segment are within 10% to 20% of their lows. So you can guess most of the guys out there are underwater, and by a hell lot!

I can still imagine more selling and given the fact that things are changing for the worse in global front, the selling can become more ruthless and in-discriminant. Buying should be avoided at all costs, I can smell a over 5% fall right around the corner!

22 January 2011

Gold and Silver : Buy the Dip?


Max Pain : January Series

January Series (which started with a bang bang selling) looks like is going to end with a whimper (unless there is some abnormal event). The max pain option strategy is pointing to a 5725 expiry which is just 30 points higher.

Only 3 days of trading do statistically scream for this outcome.


16 January 2011

Nifty Internals

The 2 charts below show that Indian Markets are yet to give bottoming sign, even in the short term. The upper chart shows that much more stocks are declining than compared to advancing, and the 10 day moving average is yet to turn up. We can expect bounces but there is still no sign of a sustained (2-3 days) of rising market.

The lower chart is based on difference between close price and weighted average of Nifty futures. Here also we see that Nifty is consistently closing much lower than the wighted average of the full trading day. This is a sign of larger players in sell mode, while the day traders slug it out most of the day, larger participants come and just SELL!

15 January 2011

FII and Money Flow

We all know Nifty follows what FII does. You don't believe it, then check the 4 year chart below. There is almost a one to one correlation between the FII flow and the Nifty gain. While the DII are mostly on the other side of the trade.


So atleast we can safely say Market Direction is mostly decided by FII flow, though they are not always correct if you look at a long term perspective. So when DII buy while FII sell, they have to bear the brunt of catching the  falling knife (the artifacts they buy are in a consistent value decline), with the hope that one day these same sellers will come and buy from them at a higher price.

The problem with DII "this time" is that they are severely cash starved. Their main source which I expect is the Indian retail investor have been investor in the Euphoric top and since then have been to hell and back. They are not easily going to be seduced this time around.

So I believe the DII will not be of any great support in a falling market if FII goes on a selling spree, which looks like they have started after 7 months of consistently strong buying. And as we know FII money however deep rooted it is, still are destined to be pulled out someday.


The above chart shows that serious FII buying started from June 2010 when Nifty was around 5000. 2 things I find striking here : first that Nifty already had doubled from lows of 2500 when this heavy volume FII buying started and second was the ferocity of this money flow. Second point can be estimated with the fact that since Mar-09 to May-10 a period of 15 months FII bought net 29k crore of equity, while from Jun-10 to Dec-10 a period of 7 months they bought 91k crore of equity! Almost a 6 times furious money flow!!

What could be the reason of such a sudden flow? Had suddenly India become a good long term investment or there was a sudden jump in Indian corporate earnings? I can think of only one reason, the money became free in the west, especially the US, where not only interest rate were at bare minimum, monetary injection started and they had to find new avenues. As a result of which dollar as well as assets denominated in dollars plunged in value. It was much more lucrative to sell free dollars that Institutions were getting in exchange of other currencies and buy assets denominated in those currencies.

Apart from India, many emerging countries which had higher interest rates, looked more attractive to these dollar holders, they bought their debt and equities as a result these countries had extra money as well as assets boomed. Now issue with this is kind of investment is that they do not create anything except for inflation and asset bubbles. Had these money been given to start a new industry growth would have emerged, but thats a risky thing for people looking to make some quick buck, knowing very clearly that once US economy recovers these money will be expected back. As a result all we get is all sorts of inflation and illusion of economy getting stronger which even many renowned economists compare with stock markets!

So to sum up I will again say that the game is to see if there is anymore scope of money to be printed in US, interest rate to be retained at these levels and fooling people to believe that the world has now been saved. As long as that continues, money will keep flowing from west and markets will remain strong, we can keep buying cars and ipads on debt. But remember once the printers stop, it will be a struggle to keep our job, forget about emi of our home and car loans and to add to the wounds we will be paying far more than now for the basic food items and services. So you know what Uncle Sam is gifting you apart from your Job... its Inflation...

Breadth Indicator : Week Ending 14 Jan 2011


I don't think we needed this chart to tell how bad things are, as per breadth of market. The peak has shifted from -80% which was already bad to worse of -90% and we have a whole lot of stocks near their lows (-100%), over 30 out of 200 odd in F&O segment which surely a sign of total collapse.

Only 22 stocks are trading above their averages and 166 are below! Things are very oversold, we can expect technical bounce from here, but the theme remains sell on rallies. The selling has been consistent and in discriminant, so beware of what you buy !

No need to point out where weakness lies, stocks showing strength are PRAJIND, MPHASIS, ISPATIND, GRASIM and CAIRN.

09 January 2011

Nifty : Volume Analysis

I have tried to do some volume analysis for the Nifty since the May 2010 lows of around 4800. Check the chart below and we can try to infer later.


Label 1 : 4786-5478, 692 pts
Label 2 : 5478-5349, 129 pts
Label 3 : 5349-6284, 935 pts
Label 4 : 6284-5937, 347 pts
Label 5 : 5937-6339, 402 pts
Label A : 6339-5690, 649 pts
Label B : 5690-6179, 489 pts
Label C : 6179-5884*, (not yet terminated)

Points to note:
-Wave 1 was strong in terms of price gain and had good average volume and highest total volume. Sign of correction to be over and money flowing in hard to get "stuff" at low price.
-Wave 2 was very shallow correction with almost equal average volume, though relatively less total volume. Most probably lot of trading happening but no one willing to sell as higher prices are expected!
-Wave 3 was very strong in terms of price gain and both average and total volume were high. This was the period for which most smart money waited.
-Wave 4 had good average volume, though it lasted not for long and as such had lower total volume, maybe still higher prices expected.
-Wave 5 had lowest average volume as well as total volume, as seeing Nifty at extended valuation and nearing long term resistance buyers were less.
-Wave A shows how selling began with a bang, it is having highest average volume.
-Wave B shows period of rebound where average volume of trading is low compared to wave A.
-Wave C though not complete is easily showing signs of damage done and pending.

So what can we make out from this very limited yet typical data points?

What I feel is that though price is king, we also need to keep an eye on volumes that are making those price moves. Like wave 2 having negligible correction though almost equal amount of average volume as wave 1, which is very easily a sign of strong buying interest. Also see how wave 5 had very poor volume (average and total), clearly showing signs of buying interest at a decline and in the same fashion wave B.

Another thing to keep in mind is that trend waves will have higher volumes when compared to counter-trend moves. Wave 1 and 3 had higher volumes than 2 and 4 etc. So as of now we are in a down-trend which even volumes are conforming.

08 January 2011

Nifty : Foreign Followers

Let me start with 2 charts, which I think is and should remain connected well into 2011.


If one looks at the two charts, finding an inverse correlation is almost unavoidable. Maybe we are not having a day to day match, but whatever we have is of very "unacceptable" quantity. Dollar sold off heavily in September, Nifty rallied significantly then, Dollar bottomed in early November, Nifty topped out then. Its only early days of 2011 and Dollar and Nifty are tied to each other almost day to day.What does this tells about Indian markets, or the approach of investors in Indian Markets?

India is looked only as another "risky" asset class and has got the benefit of easy monetary policy in the West, very much like other Asian countries. There is NO India growth story of which we keep hearing about in TV that is attracting foreign capital. Its just a rising tide of liquidity which is pushing up all boats in Asia. And we all know what happens to this kind of liquidity when its most needed.

I believe the majority of buying which took Nifty from 5300 to 6300 was done by FIIs, and if they are in need of all the money again, Nifty can well drift back to 5300. DIIs, I feel are in a sorry state, as they are bigtime cash-strapped, as there is hardly any money from retail flowing to them, rather they are facing redemption from investors who got stuck in the January 2008 crash. So they will being aware of the "game" try to outwit their FII counterparts by buying from them when they "sell in panic" and selling them when they "buy in panic". It remains to be seen who will be holding the "time-bomb' when its time to BOOM!

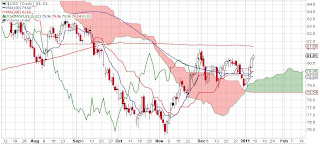
The Dollar Index chart shows the possibility of the making of wave 3 from its late November lows. It has also consolidated below 200day moving average and has started showing strong momentum above the clouds. The Ichimoku lines are almost on the verge of giving a strong buy signal. If all things fall in place for dollar and it clears 84 mark, it has very "alarming" targets. And as the charts have shown the earlier easy money trade of sell dollar and buy risk, will get re-winded pretty fast. For a rough estimate I think a run of dollar to 84 will take down Nifty to 5500 region. A relook of things again would be better to forecast what happens later.

 So don't go by what your favorite TV channel analyst says about the "reason" for Nifty's rally or correction. All of us know what and where the real game is going on.

Breadth Indicator : Week Ending 07 Jan 2011


Only 3 days of selling and breadth has totally given up. This time the selling has not only been in broader market but also in the front liners. Volume picked up after the holidays which was expected, but disappointingly for bulls it was on the downside. Peak shifted from -30% to -80%, 152 stocks are trading below their average and only 34 above theirs.

Nifty : Close - Weighted (Post 2)

Another Indicator that predicted the forthcoming selling on Friday. For more details read [ this ].

Advance - Decline : Post 2

In a follow up to the last "attempt" to get a leading indicator to Nifty's movement [ here ] I am attaching another chart which shows that Advance - Decline can be used to predict weakness and strength. Check the chart below.


We clearly see Adv-Dec 5day moving average showing negative divergence to Nifty's movement. So as the nifty crawled from 6000 to 6180, more stocks were declining than advancing. Result is you know what happened on Friday!

02 January 2011

2011 Goals : Derek Hernquist (Musings of a tape reader)

Besides the usual “eat better”, “make more time for family”, “get more organized” resolutions that we all promise each year,  I have but 2 goals.  Improve my process, and improve the execution of my process.  That’s not 2011 stuff, that’s everyday stuff.  Thought I’d share my guiding principles of market speculation, so I can hold myself more accountable.  In no particular order, my approach to managing money is shaped by the following:

1) Seek to own stocks with unmet demand, and sell when that demand has been met.  Seek to short stocks with unmet supply, and cover when that supply has been met.
2) Without a marketwide appetite for risk, company signals go mostly unexploited.
3) Fundamental investing assumes too much ego, passive indexing too little…we prefer an approach with sound principles but no crystal ball.
4) Seek to invest only when belief is so anchored that all thoughts of alternative scenarios have been abandoned.
5) Seek not to guess when a setup may occur, but allow it to unfold and then act before investors realize the magnitude of the setup.
6) Accepting risk may cause losses, but accepting unfunded liabilities and negative skew can bankrupt us.
7) Use models not to predict, but to create a range of possible outcomes for which we can plan.
8) Superior skill absolutely exists, but as an added bonus to harnessing the inherent power of capital market returns.
9) Differentiate between managers in the investment profession seeking to maximize long-term returns, vs. those in the investment business seeking to generate a larger fee base.(Swenson)
10) Asset allocation theories such as MPT contain many worthy ideas, but input frequency and lookback period are critical to capturing the true characteristics of dynamic measures such as correlation and volatility.
11) Owning “value” by itself is not the goal; we want to own something that will be highly desired by a crowd of next frame buyers at a future data and higher price.  This means being early adopters in stocks that mutual funds will “need” to own in 1-4 quarters, and asset classes that pension funds will “need” to own in 1-4 years.  We can then meet their needs by selling them our positions.
12) A long-term earnings growth line of 6% has held up as the line of truth, with profit margin oscillations causing the shorter fits and spurts.(Hussman)
13) Markets follow cycles based on the perceptions and actions of its players, and one can gain alpha by using these cycles to manage risk and reward.
14) Markets SEEK efficiency, buy offer tremendous opportunities while traveling from inefficiency to efficiency.
15) Most measures mean revert, but some trend…distinguish between the two to avoid incorrect generalizations.
16) Both people and machines have flaws, so use the best attributes of each for peak performance.
17) Forecasting is necessary but should be timid in nature, while action is not always necessary but should be BOLD on the occasions when conditions dictate it.
18) Risk management is made more complete by searching for information that differs from your analysis rather than by that which confirms it.
19) Successful practitioners turn mistakes into assets by generating learning experiences and continuous improvement.
20) Remember to distinguish between clues that are necessary, vs. a complete picture revealing a group of necessary AND sufficient measures.
21) Markets can be generally explained 95% of the time, but extreme events happen much more than a bell curve would indicate…using options guarantees that we’ll survive fat tails and grab positive skew.
22) Changes begin internally and work outward, so be constantly aware of the “market of stocks”.
23) We are certain we DON’T know what will happen, so the best approach is to figure out what WON’T happen and blueprint accordingly.
24) Diversification reduces risk most of the time, but we assume all assets are linked and eventually correlate.
25) It is critical to match ideas with the proper time frame to reduce Trend Relativity Errors…use those errors by others to enhance our alignment with the trend or signal.
26) When studying an asset, we first need to determine whether it is experiencing a trending market(positive feedback loop) or a rangebound one(negative feedback loop).
27) To gain an edge in an ultracompetitive landscape, we must wait until others reveal their hand or incorrectly commit.
28) It is critical to have both a brain and a gut; the ability to find an edge, and the fortitude to trade it aggressively.(Steenbarger)
29) Profitable opportunities are best entered in the earliest stage of latent power being converted to energy.  Too soon is a waste of capital, too late involves too much risk.
30) We must have the open mind of an artist and the hard-nosed skepticism of a scientist.(Steenbarger)
31) Virtually all long-term strategies are positioned to simply ride the tailwinds of rising prices.  It is imperative to have methods to protect us from both headwinds and crosswinds to avert disaster.(Easterling)
32) When a rule is adopted, it marks the beginning not the end of the process…execution is key.
33) While anecdotal information can be helpful, they are gray areas of subjectivity that can’t compare to the objectivity of measuring performance.  Anyone with an open mind can create a persuasive case for ANYscenario, so beware mindtraps.(Tharp)
34) Treat volatility as a psychological risk to be managed into an ally, not as a financial measure of risk to obsess over.
These are all copies or strong imitations of what others have stated elsewhere…there are no market sentiments that have not been expressed somewhere.  These are just the ones that have struck a chord with me, and I’ve been able to absorb as my own.  Most reading this already have such a list, if not maybe that’s a good New Year’s weekend goal.  For me, 27, 32, and 34 are hardest to execute and thereby need reminders.  After re-reading this, my goal for 2011 is to write the same post in half the words next Dec!

Breadth Indicator : Week Ending 31 Dec 2010


Some more improvement in the breadth can be seen when compared to last week, which is obvious as market kept crawling higher and losers played catch up. Volume apart from expiry day was dismal and only the end of holidays and Q4 earnings can put some life into the market. Peak has shifted from -50% to -30%, which is good news. 115 stocks are trading below their Jan expiry price average and 72 are trading above it.As said earlier materials and IT are the best performer.

Sectoral Performance : December


Nifty gained 4.6% in December 2010, but if you look at the sectoral performance only 6 out of 19 sectors were the contributors, majority of the contribution was done by IT and Materials.

01 January 2011

Seasonal Effect : January

With new year comes new hopes and resolutions! How much does this impact stock markets? January since 1991 has been a 50-50 kind of month. But recently it has started to become a roadblock for bulls. If you see the chart below, out of 20 years 10 has been positive and 10 negative, but the average return has dwindled in the last decade. Has this become a norm now of buying in December and selling in January?


We are already stretched in terms of oscillator conditions technically due to non stop December creep up. I would expect some correction during the mid-month period. How things look after that will decide whether January can break the 3 year streak of under performance.


Now coming to the daily seasonality in January, as you see initial few days are mostly positive for markets! New year hopes and festive spirits looks to be still in force, but mid-month period puts a pause to those. Overall I think January is/should be an exciting month, when people are back to work and some pending decisions are taken!