29 October 2011

Nifty : Trend Line Attraction ?

Recent rally has been a typical example of how stocks climb a wall of worry. There has been a sudden shift in sentiment though after yesterday's 3% rally. Now all the lower targets has been replaced by higher targets. Lets look at a chart to get some idea where we are technically.


The above chart shows Nifty (blue) and advance decline line (red). First lets focus on Nifty closing price, it clearly looks to be bound in the channel (black and green trend lines). There was a false breakdown late August, but respected in early October. Now Nifty is targeting the upper trend line around 5450-5500. If you notice, this trend line has resisted Nifty on 3 different occasions. So we can surely consider it to be a strong resistance. The red advance decline line has been falling consistently, we can argue it has bottomed, but will have to wait for further confirmation.

What can we expect from here on. Firstly, the test of the upper trend line by Nifty looks inevitable. So 5450 give or take some points is very much to be expected in near term. Now comes the difficult part, Nifty has been overbought in all smaller time frames other than weekly. So ideally we can expect Nifty to halt or maybe even correct (especially near a strong resistance) some amount to get rid of these overbought conditions. I would say even a retest of 5180 ( the break out area) might be possible and should be good for longer term bullish scenario. Though if sentiment remains bullish we may never see these levels and a 5250-5300 would be enough of correction. We can expect another stronger wave of buying from these levels, one which should see the upper trend line broken, which means 5700 as first target and 5900 as second. I believe even new highs are possible once the trend line is broken with strong volumes. Though it will take its own time.

Next possible scenario for me would be test of upper trend line and then back to the test of lower trend line, which would be much below 4700, I think 4500 would be a good enough target for it, if not lower. In that case these two trend line will still remain in play for future.

There is yet another scenario which I can come up with, which would be this rally to carry on without any pause at the trend line. This would be the most difficult one to play as logic would be overtaken by emotions. I feel in that case the rally can keep going on much higher or after sucking a lot of panic buyers Nifty will succumb under its own weight of expectation and fall below the broken trend line and keep falling much lower

Lets see if any of these happen or there is some other trick under Mr. Markets sleeve. As I always say, its not about getting your technical study right, its about being ready for any drama that unfolds. Being a trader, I keep my bullish hat close and bearish closer!


24 October 2011

2008 Redux

Came across many posts which compared the current technical structure of S&P 500 with that of 2008 pre Lehmann structure. I thought it would be interesting to do a similar Nifty study. I hardly believe these kind of studies make sense, but they definitely make a good story!


If you look at the chart above and focus on 2008 structure, we see that after a strong correction from 6300 to 3800 in 6-7 months, Nifty staged a strong comeback from 3800 to 4600 in few weeks and I am sure looked strong enough for more rally. But there was hardly any followup buying after the initial correction and soon Nifty did a nosedive. Obviously there was the panic of Lehmann bankruptcy to spook it.

The current structure though have a similar pattern like the placement of price in comparison with 20 and 50 week SMA. MACD which being the derivative of price has to follow the same pattern. The most obvious difference is the fact that this correction has been much slower and on lower volumes.

Another point of debate could be the fact that Lehmann collapse took almost everyone by surprise (can't say many people expected it) but the current Greece situation has given enough time for bears and bulls to assess the situation.

So will history repeat itself in coming weeks or will this pattern fool its watchers?

15 October 2011

PCR For Breakout ?

There is something about October Series which doesn't want me to believe the data! Nifty had a terrible August and a poor September, the start of October wasn't great and people (including me) were expecting 4500 to be tested soon and some even went ahead to say 4300 on camera! Overall sentiment was very pessimistic and that made difficult for Nifty to move lower.

But market always has a mind of its own. And it will punish the majority severely during turning points.  The rally Nifty has seen has been spectacular to say the least. Cutting the prelude, let me immediately come to the point which I am observing here.


The above chart is Nifty Vs Near Month Expiry Nifty PCR (Put Call Ratio). The upper panel shows PCR while lower has Nifty, the vertical lines are expiry dates. Focus on the upper panel for the time being. It shows Nifty PCR at a level not seen since June and March expiry (Red Lines). The June instance is on a day before and on expiry day. While March instance is few days before the expiry. Considering  we have 7 trading days still left for expiry, I am concerned about the optimism that has got built. Though build up of optimism is not bad, especially in option space, we should take this with a pinch of salt.

Now check what happened on Nifty during the March high PCR instance (I ignore June series as its too close to expiry and squeeze is expected from the losing side), Nifty almost went vertical from around 5550 region to close around 5800. Also note how it broke out from the resistance around 5550 (blue line) which had stopped it 2 times earlier (3rd time lucky?). Now doesn't it look very similar here in October series?

Breaking out of 5180-5200 zone by Nifty will surely make a strong case for another 200-300 point in this series itself. But could there be false break out given the news driven environment? Very much so, especially if there is no consolidation below this resistance. The rally here has been incessant and needs some more time to digest the current gain. But as in Life and so in Markets anything can happen! The inclination is for the long side, but there is something which doesn't want me to believe the data!

06 October 2011

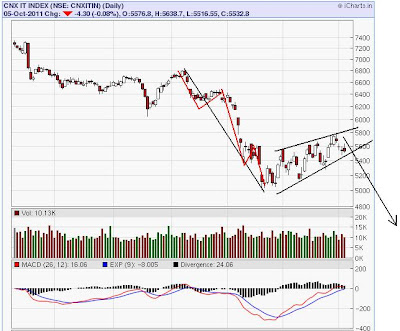
IT Index : Coding Correction ?


Can't say anything good about the above chart (CNXITIN - The IT index chart). After a decline which looks to be in 5 wave, there is an upward correction in a rising wedge pattern. I don't see it going higher than 5800. A break below the lower trendline should see this Index reach 5000 in a swift manner with ultimate target being 4000.

Many guys see IT index as a savior in times of Rupee Depreciation. I don't feel that is ever going to help, Dollar   strength is always due to crisis in risk assets and IT stocks of India ARE risky assets.

01 October 2011

Peter Brandt


Lessons from seven weeks of stock market chop

For those of you who wish to gain knowledge in classical charting principles, the choppiness of the past seven weeks in the U.S.stock market indexes offers some excellent lessons.
 Let me meander through these lessons, not necessarily in a sequential order.
First, this choppiness has likely to have been financially punishing for those who missed the initial major thrust from late July through August 9. Why? Because the natural inclination of human emotions is to trade yesterday’s market. Feeling as though one had missed out on such a massive move, a trader would press the issue expecting the market to offer a second chance.
Second, corrections can become complex. Charts that enter trading ranges tend to morph from one pattern to a larger pattern. What looked like a small retest wedge in the Nasdaq 100 on August 17 turned into a flag by early September. A completed flag in the S&Ps on September 12 quickly failed and reversed. A possible continuation H&S completed by the Dow on September 12 also failed to materialize. A possible intraday secondary completion of a bear channel in the Nasdaq on Thursday quickly reversed. Morphing is the norm for range bound markets.
It is important to add, relative to point number two above, that at no time was the range resolved. There were many smaller possible patterns within the range, but the range was never violated. Playing smaller patterns within larger patterns (often with hourly charts) is dangerous territory.
Third, and some of you might have burned on this one, selling a period of weakness or buying a few days of strength within a range-bound market is a losing bet. If you write one new rule onto your ever lengthening rules list, make it this one. Reversion to the mean is the norm for ranges. Within ranges, if you have to trade (which you should not have to do), sell at the upper end and buy at the lower end until the range has been resolved.
Fourth, the wedge in the Nasdaq, the flag in the S&Ps, the pennant in the S&Ps and the channel in the Nasdaq were all “diagonal patterns.” Readers of my book will understand this concept. I generally hate diagonal patterns, defined by boundary lines that slant. Diagonal patterns are the worst characters for morphing. Horizontal boundary lines that account for all of the lows within a congestion (the continuation H&S in the Dow did not do this) are what you want to look for.
Fifth, there are several MAJOR dangers to trading within a range-bound market.
  • Getting chopped up within the morph can make you gun shy when the real breakout occurs.
  • Range bound markets tend to force a chartist into violating his or her trading rules.
  • A compulsion for being pre-positioned for the “next” big breakout can result in a trading becoming obsessed with a market. This is never good. You should never feel as though you have to have a position or you will somehow miss a move.
  • Being obsessed with a particular market can cause you to miss good opportunities in other markets.
  • Being obsessed with a particular market can force you start monitor-watching. Monitor-watching will play on your emotions and force you out of good decision making skills.
Sixth, markets go when they are ready to go, not a second sooner. The stock market will resolve itself at some point.  I really thought yesterday was going to be a resolving day. It was not. So be it. There was a day in the futures markets when a strong move intraday had follow through. This was when there were pit exchanges and pit brokers and before the day of mean reversion HFT trading operations. Intraday thrusts can no longer be trusted within a trading range.
In the meanwhile predetermine a day in advance what your game play will be. Using market orders or tight limit orders within a trading range is a good indicator you are making a bad judgment. Avoid selling weakness and buying strength within a range. Keep your powder dry. Be patient.

Nifty : From One Range to Another

For past few weeks of Nifty has been caught in a range between 4720-4750 to 5160-5180. This is a very classical case of contraction after an expansion, but the reverse is also true, that after contraction comes expansion.


Coming to the charts, I have marked the descending triangle, which got broken in August by a massive gap. The target of this triangle is, height of the triangle from the break point (5200 - 900 = 4300). I was expecting this target to be met pretty soon, but looks like 4700 to 4800 support area has other ideas in mind.

I have also marked the current rectangular area in which price in consolidating, the height of this is around 460 points and should target 5640 (considering break at 5180) region in case the break is on upside and 4260 on downside (considering break at 4720).

Note that a downward break will satisfy the descending triangle target as well, but in case of upward break the triangle pattern will be invalidated. (Actually any move back into the triangle, which means above 5200 will invalidate the target of 4300 through this observation).

With so many fundamental overhangs and trading so much news driven, its almost impossible to have conviction in any side of trade. And hence the trading range getting developed in all major markets of the world. One day all problems are solved.. the other world comes to an end.

In my opinion, I am still a bear, though my conviction is as well weakening. 5200, I guess is the line in the sand, above that 5600 is taken for granted and maybe a new high. On the downside there are a hell lot of targets that one can talk about starting from 4500 to 3600!