30 May 2015

Nifty : Make or Break coming soon

As per last blog we got a bounce from 8000 (7997 to be exact). Nifty almost reached 8500 but has lost momentum in the resistance zone of 8450-8600. As per the new chart we see new resistance zone developing around 8500-8600 yet again and until 8600 is crossed the chances of this rally to fail exists. Support exists around 8000 and 7700 on the downside.


In my opinion we should definitely test 8000 again and in most likelihood even test 7700 if 8000 psychological level is breached. But before we do that we should get one sell candle in the region of 8500-8600, as we have got in almost all the last four swing highs recently! Another reason I believe Nifty would test 8000 and below is the fact that we are yet to see a strong positive divergence on the MACD and RSI oscillators.


03 May 2015

Nifty : Dead Cat Bounce Ahead?


While looking at the daily charts after a really long time, apart from a clear Head and Shoulder pattern what you can easily see is strong resistance in the 8500-8600 region while support can be expected around 8000.

I also see some divergence in the oscillators and would be reasonable to expect some rally after such a strong selling. The fact that long term trend is still intact, I expect the current correction to be of zig-zag type. So either the correction has almost ended (which I doubt) or there is at least another leg down; which can only start after a leg up from current level. So after a 1000 point correction, an upward correction of 38% to 50% is expected. Interestingly a 400-500 point does coincide with the Resistance!

10 April 2013

Balenthiran, The 17.6 Year Stock Market Cycle


The profile of a bull market cycle resembles an Elliott Wave sequence, although Balenthiran notes that, in contrast to Elliott Waves, his cycle “has distinct phases of fixed time and direction” and “is not trying to determine by how much the stock market may increase or decrease in that time.” (p. 30) Nonetheless, his bull market cycle has an initial leg up lasting four to five years, a sharp correction lasting one to two years, another rally lasting four to five years, a mild mid-cycle correction, and finally a major bull market top. In his stylized version, the rough 4-5 and 1-2 figures get turned into more exact numbers: 4.4 and 2.2 years.

The bear market cycle is more complex. It starts with a bear market crash lasting approximately two years, is followed by a rally lasting four to five years, a second bear market crash lasting around two years (often, he claims, the lowest low), a two-year bear market rally, a major bear market low (not necessarily the lowest low), a final bear market low, and finally the end of the bear market cycle.

So, what can we expect? The current bear market should end in 2018, with the final low coming this year. This low is “not likely to be lower than that seen in 2009, but ideally below the 2011 high.” (p. 57) This may be a good entry point for the new bull market even though it comes five years before the start of the next long-cycle bull market.

Perhaps this is what all the money sitting on the sidelines is waiting for

12 November 2012

The Eight Scariest Charts For Equity Bulls : From Zero Hedge


The Eight Scariest Charts For Equity Bulls

It would appear Mark Twain's infamous quote that "history does not repeat, but it does rhyme" has never been so apt. The following eight charts suggest the rhythm is getting louder and louder. How is it possible? It's nonsense? Well at the heart of the markets, it is still us humans and our endearing greed, fear, and heuristic biases that drive the flows... trade accordingly.

The current price action in the S&P 500 is eerily similar to the movement leading up to the collapse in 1987... (via Bloomberg)


The Dow is also tracking this move almost perfectly over the last two years...(via Citi)


The next three charts are particularly concerning...
Here is the Dow leading up to the 1987 drop - showing its distance from the 55-week average and the collapse once it crossed... (via Citi)


here is an unnamed stock's price action (percentage change) over the past three years...(via Citi)


and AAPL's price appreciation from the lows in 2009 and its 55-week average...(via Bloomberg)


It's not just 1987... Here is the Dow analog again the 1977-78 period and 1905-1910 period... (via Citi)


and the Dow Transports are playing out a very similar pattern to the 1960s-70s... (via Citi)


And a Bonus Chart - for those who prefer to look at Bond Analogs... Here is the current move in 10Y US Treasury yields overlaid on 1992's movement... spooky no? and somewhat fits with a view of weakness into year-end, downgrade on debt-ceiling and collapse... (via Citi)


Machiavelli accounts for this 'repetitive' oscillation by arguing that virtù (valor and political effectiveness) produces peace, peace brings idleness (ozio), idleness disorder, and disorder rovina (ruin). In turn, from rovina springs order, from order virtù, and from this, glory and good fortune.
Machiavelli, as had the ancient Greek historian Thucydides, saw human nature as remarkably stable - steady enough for the formulation of rules of political behavior. Machiavelli wrote in his Discorsi:
Whoever considers the past and the present will readily observe that all cities and all peoples... ever have been animated by the same desires and the same passions; so that it is easy, by diligent study of the past, to foresee what is likely to happen in the future in any republic, and to apply those remedies that were used by the ancients, or not finding any that were employed by them, to devise new ones from the similarity of events.

“Everything that needs to be said has already been said. But since no one was listening, everything must be said again.” — André Gide
Charts: Citi and Bloomberg (as marked above for clarification - not all charts are sourced from Tom Fitzpatrick of Citi)

16 September 2012

Book Review : The Value Investors: Lessons from the World’s Top Fund Managers


Chan, The Value Investors

Ronald W. Chan introduces an interesting cast of characters, many of whom may not be familiar to readers. In The Value Investors: Lessons from the World’s Top Fund Managers (Wiley, 2012) we meet Walter Schloss, Irving Kahn, Thomas Kahn, William Browne, Jean-Marie Eveillard, Francisco García Paramés, Anthony Nutt, Mark Mobius, Teng Ngiek Lian, Shuhei Abe, V-Nee Yeh, and Cheah Cheng Hye.

Irving Kahn, age 106, has the distinction of being the oldest living active investment professional. Both he and Walter Schloss, who died this year at the age of 95, were students and later employees of Benjamin Graham, so they have impressive value investing pedigrees. Their first jobs were with Wall Street firms; eventually they founded their own highly successful businesses.

I mention the job history of these two men because I was struck by how relatively late in life (of course, not by Kahn standards) many of the value fund managers interviewed in this book found their true calling. Mark Mobius, for instance, of the Templeton Emerging Markets Group fame, started his career as a business consultant (to be more precise, a consulting research coordinator) in Tokyo, studying consumer behavior in the region, and later founded his own research-oriented business consulting firm. Cheah Cheng Hye, co-founder of Value Partners, the largest asset management company in Asia, worked in journalism for eighteen years before he entered the financial world as a stock analyst.

Other future value fund managers started off in finance but faced a different kind of hurdle. They were hired by firms who were devoted to growth investing. They felt uncomfortable in their jobs, though not necessarily understanding why. It took them some time to realize that they were, for whatever psychological/intellectual reasons, at heart and in mind value investors.

Value investing is in many ways an intellectual no-brainer. It’s smart bargain shopping. You buy a lot of pasta at 50% off because the supermarket messed up its inventory but avoid the strawberries that are on sale because they’re half rotten. Simple enough. On the other hand, value investing is extraordinarily difficult emotionally. You buy a stock that you think is undervalued only to see it become even more undervalued (and that’s if your analysis is correct). You may buy more if you’re self-confident, but you have no external validation. The market is telling you that you got it wrong. And, yes, the market is often right.

The value investors that Chan profiles, all of whom have handily beat their benchmarks, are not a particularly stressed lot. In fact, many of them explain what investing techniques they use (in some cases merely diversification) to be able to sleep soundly at night and avoid stress. I suspect, however, that the real explanation lies not so much in methodology as in personality. It takes a special kind of person to take the inevitable lumps (such as not participating in the dot-com boom) as well as to enjoy the long-term, often slow-grind upside of being a talented value investor.

Chan’s book is a good read. Value investors may make some new international friends. Struggling individual investors may find a style that resonates. And frustrated, antsy twenty somethings may come to realize that life doesn’t end at thirty.

11 February 2012

Nifty Breadth Update

After a long overdue bounce turning into a bull market, Nifty is showing signs of exhaustion and a potential short term reversal. Will this expected short term reversal turn into a bear market? A test of 5200 should be definitely expected in near future, below 4800 things will become dangerous.


01 January 2012

The New Year : UpsideTrader


learning The New Year
“The pessimist sees difficulty in every opportunity. The optimist sees the opportunity in every difficulty.”-Winston Churchill

Amateur night is almost upon us as people form all corners of the world will try and  channel positive karma and hope for the new year. It’s just a date on the calendar, truth is we can all change ourselves for the better at any second of any minute in any hour anytime we want. We just use this date to try and memorialize it. The liquor industry loves this day as clubs, saloons and gin mills go eight deep at the bar. Teetotalers will break down their wall and do shots of tequila while wearing propeller hats. They will vomit violently at several points as their Gucci’s become ruined. They will also realize during this violent act of reverse peristalsis how little they chew their food. In some rare cases arrests and divorce filings may result. Tomorrow morning, most will wish they just stayed home and ordered Chinese food.

Many Danish leap off chairs at midnight on New Year’s, hoping to ban all bad spirits in the new year.
At midnight on New Year’s, Spaniards consume 12 grapes and try to consume all of them by the time the clock stops chiming. They will worry about solvency on Monday.

In South America, those who wear red underpants, are hoping for love in the new year. Those who wear yellow, are wishing for money.

The ancient Greeks paraded around in the streets with a baby in a basket on New Year’s Day. It’s part of the cradle to grave thingy.

Fire crackers are set off to frighten off evil spirits on New Year’s Day in China. They will create new and exciting ways to cook the books on their public companies on Monday.

The Romans began a tradition of exchanging gifts on New Year’s Eve, by giving one another branches from sacred trees, for good fortune. Berlusconi just sits around with hookers.

88 percent of all New Year’s resolutions end in failure.

As far as the market and trading goes this year, it will be more of the same for me. We are all a work in progress as traders, so to say that there the wont be tweaks and nuances would be a lie.

1- All media is shut OFF during trading. What Mike Holland and Bob Doll think I should do is meaningless. Please realize that when they come out positive on a stock it’s for a three year hold, if that’s your thing then have at it.

2-The hardest thing to do, tell myself every morning that what I think couldn’t be more meaningless. I may think the market will get crushed for a multitude of reasons, but if the tape is higher, I will just be long. Same goes for the short side.

3-I think my longest hold in 2011 was one month. I may extend that time frame on certain names. Almost perfect entries will be of utmost importance.

4-Based on that, more hedging will need to happen.

5- I will have more exposure to global markets both long and short, there will be a lot of action there.

6-No trend no trade. If it ain’t happening I’ll watch and wait. I don’t have to be in it to win it all the time.

13 December 2011

Why I’d Steer Clear of Emerging Markets


Why I’d Steer Clear of Emerging Markets… For Now


While stocks continue to float on ether and pipedreams, the commodities, credit, and bond markets are all forecasting another round of deflation. Whether it arrives now or in the near future remains to be seen. But he fact remains that at some point we’re going to have another 2008 event. The most likely cause will be Europe, but with the Middle East heating up, and Bernanke’s loose money policies becoming more and more politically toxic in the US, who knows?

On that note, I expect emerging markets to underperform US indexes going forward. One chart I use to view how these two assets perform relative to one another is to price the Emerging Markets ETF (EEM) via the S&P 500. When this chart rallies, Emerging Markets outperform the S&P 500. When this chart falls, the S&P 500 outperforms Emerging Markets.


As you can see, since August, the S&P 500 has outperformed Emerging Markets with the exception of a few brief periods. I expect this trend to continue with US markets holding up better than their Emerging Market counterparts as we’ve recently broken major support.

Indeed, the long-term chart of EEM relative to the S&P 500 shows that the love affair with Emerging Markets may indeed be ending:


As you can see, we’ve broken below MAJOR support here and have since failed to reclaim this line (indicating that former support is now resistance). This is a VERY bearish chart which indicates that we are very likely entering a prolonged period in which Emerging Markets will underperform US indexes dramatically.

Prepare accordingly.

03 December 2011

Nifty : Triple Zig - Zag ?

The recent Nifty moves must have fooled many traders : the intraday breakdown of 4700, but the inability to close below it on the daily chart pointed towards a possibility of a strong upward reaction. We got that as well, can't say how many traders would have caught that move.

Next thought that comes in mind is how much more this rally can carry on, or have we made a short/medium term bottom. I took a look at the kind of pattern that has developed since last year, which in Elliot terminology looks like the formation of a triple zig-zag.


In the above table, I have marked the waves as A, B, C and X. Zig-Zag type of correction generally tend to have a relationship among its counterpart waves. As we see the first 2 wave Bs are around 75% retracement of wave As, also wave Cs are roughly 150% extension of wave A. The lower table shows wave Xs being about 60% retracement of the entire 3 wave correction.

The bottom 2 rows of the upper table is where I have tried to use this relationship to estimate the target of the current upward wave and the target of the next final C wave down. So the target of current rally looks to be ending around 5200 (nice resistance!) and finally a break of all supports to reach somewhere around 4100 (this is currently a vague target, underlying thought being another 1000 point or more massive fall).

The reason I am still suspecting another fall is the fact that we are still awaiting a resolution of all these European s***. The fact that all central banks come together to provide liquidity means there was something very terrible about to happen. The current effort is just another kick on the can. I am expecting market to realize sooner than later the hopeless situation Europe is in and the solution lies in taking the pain rather than buying another dose of the same drug.

The rally is also very technical in nature due to the fact markets was oversold and seasonal factors suggests some kind of year end Santa Claus rally! I feel we are going to make another top in late december or early january and then have a terrible Q1 2012. Hopefully 4000 or roundabout Nifty should find its feet.

26 November 2011

Longer Term View : Ichimoku Dependent!

Some time ago, I posted a weekly chart, requesting all my readers to exit out of equities because something happened in the charts which was signalling the end of bull market which started from October 2008. Which meant all rallies should be now sold into. That happened in January of this year, when Nifty after making its first lower high, formed a bearish engulfing candlestick pattern. Subsequently Nifty gave a sell signal on the Ichimoku Cloud as well. Since then Nifty has made a series of lower highs and lower lows.


This week it has broken the 200 week moving average, another confirmatory signal, which the long term players should beware of. Investing now, and giving valuation as a reason, would be foolhardy. The above chart shows how Nifty took some support at the 200 week moving average, and also gave a buy signal in October but the rally soon fizzled out and since it broke the 4700 support, another round of heavy selling could be expected even if there is some relief rally.

I wanted to point out, in this post the beauty of Ichimoku cloud which did not give any sort of buy signal, even though there were strong rallies from February to April and then in October. Ichimoku still believes that the trend is down and because its below the cloud expecting any kind of immediate support would be stupid.

I would like to point out that the monthly charts shows 4000 as support area.


Technically from an investing point of view, I will until there is a higher low formed on the charts and Ichimoku buy signal.

Could Not Resist Re-Posting It !


Happy Thanksgiving — the Dow could be going to 4,000


I hate to be the turkey of the day/month/year, but we are in a bear market. The only question is how low will this turkey go?
I am a chartist. I deal in chart patterns. I deal in possibilities, not probabilities and certainly not in certainties. I can only state what a chart is telling me by its geometric construction — and geometric patterns, even when clearly identified, are subject to failure.
Nevertheless, I am obligated to call a chart for what it is. Part of chart analysis is determining the price targets implied in a certain chart patterns. I get loads of criticism on this one. Whenever I state an implied objective of a pattern I hear the same whine:
“But, but, but,but, Brandt, you say in your book that charts are a trading tool and not to be used for price forecasting. Yet, Brandt, you make price forecasts. You are confusing me. You say charts should not be used for making price forecasts, but that is exactly what you are doing.”
If you are in this camp, I have one thing to say to you –  get over it, learn to live with it.
Charts are NOT for price forecasting. But a chart pattern carries an implied price move. I recognize that any given chart pattern has a significant chance of failure. But until a pattern fails or is not modified by a contrary pattern, then price targets are a good guideline.
When prices act contrary to the implications of a chart, then I run for the hills. But until then, I retain strong opinions (weakly held). If you can’t understand this nuance, that is your problem, not mine.
OK, all this was a build up to your Thanksgiving gift — a price forecast in the DJIA. Please step back and take a 30,000 foot view with me.
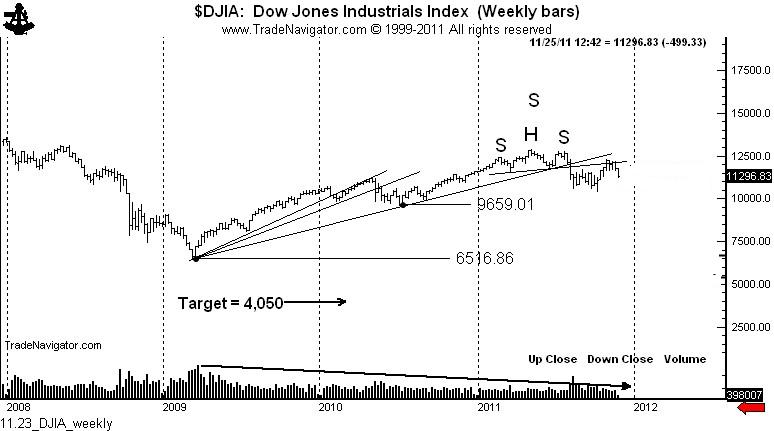
The rally from the March 2009 low was on decreasing volume. Rallies that do not draw in the public are very suspect, and prove more often than not to be corrective rallies. In this case, the correction is of the 2008 to 2009 price decline. That’s right, the volume profile of the this 32-month rally is much more typical of a bear market rally than of a genuine bull trend.
The founders of classical charting  (Schabacker, Edwards, Magee) identified something called a 3-fan principle. The 3-fan principle specifies that a corrective rally may be defined by trendlines with decreasing angles of attack. The concept also specifies that the violation of the third fan line establishes the top  of the corrective rally — and that the subsequent decline will retrace the entire distance of the corrective rally.
Now, you may want to give me with all the reasons why a return to the 2009 low is not possible. That’s fine — but, keep it to yourself. I will change my mind when price makes me change my mind, not one moment before.
The fact that the daily and weekly charts completed a H&S top simultaneously with the violation of the third fan line is a confirmation that the May and July highs will not be breached. Another classical charting principle is that H&S tops and bottoms (when they meet all of the criteria for the pattern, which this H&S top did do) represent a major turning point in a trend.
Next, let’s move from a 30,000-foot view to a perspective from the space station. Should the implications of the 3-fan principle be realized, something very, very, very (do I need to repeat the word “very” again?) significant would become apparent to a chartist.
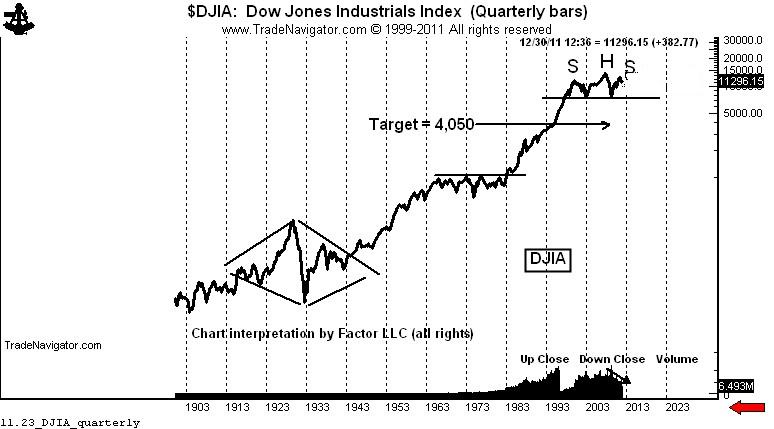
A move back to the 2009 low on the quarterly semi-log chart sets up the possibility (not probability, not certainty) of a 13-year H&S top whereby the entire advance from the March 2009 low is nothing more than the right shoulder of this massive configuration.
Should the market decline toward the 2009 low, then the massive H&S top on the quarterly chart becomes a real (but wild) possibility. The rules of classical charting specify that a decisive completion of a H&S top should lead to a decline equal to the height of the H&S.
On an arithmetic basis, the target in the Dow would become lower than 1,000. On the semi-long chart the target would be around 4,000. So I will use the higher target.
Do I really think the DJIA will decline to 4,000? I have no idea. But I do know this — that if it does it will be one wild (and hopefully profitable) ride.

19 November 2011

Nifty : Channeling Challenge

Last week's market action has caught the bulls off guard. After the October rally November was expected to be a follow through month or at the most a consolidation period. Well, taking market lightly never works!


Above is the weekly chart, the crack below 20 week moving average, shows that the bullish momentum is long gone and its time to beware of the bears. The other important observation is Nifty's inability to even challenge the upper trend line. This shows that Nifty was weak in its up move and the down move would be harsher!

Obviously all hopes are now on 4700 providing the support. I have generally seen, when some kind of level is over watched the market tends to ignore it and catch most people on wrong foot. So we can expect no support there (bulls would be crushed) or Nifty not at all reaching there (bears would be fooled). I believe the former to be more likely. The ultimate trick the market can play would be to fool both bulls and bears, which would be crashing below 4700 stop out all bulls and suck the bears in and then rally furiously much higher! This would be the toughest scenario to work on and "the vigilant" would be rewarded.

Another point I would like to make is about volumes. I know that the F&O volumes have been quite high, but the cash market volume is certainly pathetic. You can see how whole of 2011 have been on quite low volumes. Traditional technical knowledge suggest that a sell off on low volumes is a sign of correction in a predominant uptrend. But there is another aspect of it, low volumes can also be a reason for concern. Low volumes means there are less sellers with conviction, but it also means there are less buyers with conviction. So the correction with lower volumes cannot be taken for granted to be a dip to buy in.

I will be surprised if 4700 provides a great deal of support in coming weeks. The lower trend line is one to be watched and in case it breaks, well, welcome to the panic street!

Six Keys to Being Excellent at Anything


Six Keys to Being Excellent at Anything

I've been playing tennis for nearly five decades. I love the game and I hit the ball well, but I'm far from the player I wish I were.
I've been thinking about this a lot the past couple of weeks, because I've taken the opportunity, for the first time in many years, to play tennis nearly every day. My game has gotten progressively stronger. I've had a number of rapturous moments during which I've played like the player I long to be.
And almost certainly could be, even though I'm 58 years old. Until recently, I never believed that was possible. For most of my adult life, I've accepted the incredibly durable myth that some people are born with special talents and gifts, and that the potential to truly excel in any given pursuit is largely determined by our genetic inheritance.
During the past year, I've read no fewer than five books — and a raft of scientific research — which powerfully challenge that assumption (see below for a list). I've also written one, The Way We're Working Isn't Working, which lays out a guide, grounded in the science of high performance, to systematically building your capacity physically, emotionally, mentally, and spiritually.
We've found, in our work with executives at dozens of organizations, that it's possible to build any given skill or capacity in the same systematic way we do a muscle: push past your comfort zone, and then rest. Aristotle Will Durant*, commenting on Aristotle, pointed out that the philosopher had it exactly right 2000 years ago: "We are what we repeatedly do." By relying on highly specific practices, we've seen our clients dramatically improve skills ranging from empathy, to focus, to creativity, to summoning positive emotions, to deeply relaxing.
Like everyone who studies performance, I'm indebted to the extraordinary Anders Ericsson, arguably the world's leading researcher into high performance. For more than two decades, Ericsson has been making the case that it's not inherited talent which determines how good we become at something, but rather how hard we're willing to work — something he calls "deliberate practice." Numerous researchers now agree that 10,000 hours of such practice is the minimum necessary to achieve expertise in any complex domain.
That notion is wonderfully empowering. It suggests we have remarkable capacity to influence our own outcomes. But that's also daunting. One of Ericsson's central findings is that practice is not only the most important ingredient in achieving excellence, but also the most difficult and the least intrinsically enjoyable.
If you want to be really good at something, it's going to involve relentlessly pushing past your comfort zone, as well as frustration, struggle, setbacks and failures. That's true as long as you want to continue to improve, or even maintain a high level of excellence. The reward is that being really good at something you've earned through your own hard work can be immensely satisfying.
Here, then, are the six keys to achieving excellence we've found are most effective for our clients:
  1. Pursue what you love. Passion is an incredible motivator. It fuels focus, resilience, and perseverance.
  2. Do the hardest work first. We all move instinctively toward pleasure and away from pain. Most great performers, Ericsson and others have found, delay gratification and take on the difficult work of practice in the mornings, before they do anything else. That's when most of us have the most energy and the fewest distractions.
  3. Practice intensely, without interruption for short periods of no longer than 90 minutes and then take a break. Ninety minutes appears to be the maximum amount of time that we can bring the highest level of focus to any given activity. The evidence is equally strong that great performers practice no more than 4 ½ hours a day.
  4. Seek expert feedback, in intermittent doses. The simpler and more precise the feedback, the more equipped you are to make adjustments. Too much feedback, too continuously can create cognitive overload, increase anxiety, and interfere with learning.
  5. Take regular renewal breaks. Relaxing after intense effort not only provides an opportunity to rejuvenate, but also to metabolize and embed learning. It's also during rest that the right hemisphere becomes more dominant, which can lead to creative breakthroughs.
  6. Ritualize practice. Will and discipline are wildly overrated. As the researcher Roy Baumeisterhas found, none of us have very much of it. The best way to insure you'll take on difficult tasks is to build rituals — specific, inviolable times at which you do them, so that over time you do them without having to squander energy thinking about them.

I have practiced tennis deliberately over the years, but never for the several hours a day required to achieve a truly high level of excellence. What's changed is that I don't berate myself any longer for falling short. I know exactly what it would take to get to that level.
I've got too many other higher priorities to give tennis that attention right now. But I find it incredibly exciting to know that I'm still capable of getting far better at tennis — or at anything else — and so are you.

Here are the recent books on this subject:

* Thanks to commenter Rick Thomas for pointing out the misattribution.

Tony Schwartz is president and CEO of The Energy Project. He is the author of the June, 2010 HBR article, "The Productivity Paradox: How Sony Pictures Gets More Out of People by Demanding Less," and coauthor, with Catherine McCarthy, of the 2007 HBR article, "Manage Your Energy, Not Your Time." Tony is also the author of the new book "The Way We're Working Isn't Working: The Four Forgotten Needs that Energize Great Performance" (Free Press, 2010).

15 November 2011

Emerging Market : Decoupled the Wrong Way?

For the past few days and weeks, I am observing that Nifty is under performing US markets. When Dow rallies the natural tendency is to expect Nifty to rally the similar percentage points and when it falls the same amount of correction. In the current environment where Global headlines dominate the proceedings I think its fair to assume it.

But as you too must have noticed, Nifty is not at all picking much of the positive sentiment that has developed recently in the US markets atleast. The chart below compares Nifty Vs S&P 500 for the past 3 years.


As you can see from Oct 2010 to Feb 2011 (4 months) Nifty has under performed SPX, since then it has been at par with it. Is another bout of under performance coming up for Nifty? Also notice how since Dec 2008 till July 2009 Nifty was trumping the SPX.

What I feel is that when RISK ON trade is on, emerging markets do much better than developed markets, and when RISK OFF trade is on, it fairs much poorly. So if fear trade is to carry on for some more time, expect Nifty SPX ratio to hit the 3.5 mark in near future. I checked the similar chart for Hang Seng instead of Nifty and it also tells the same story, only the situation is more grim.

13 November 2011

Ed Easterling’s 12 Rules of Market Cycles


Ed Easterling’s 12 Rules of Market Cycles

Ed Easterling of Crestmont Research boils down his views on long term markets to 12 rules of secular stock market cycles. In case you are unfamiliar with Ed’s work, several books, including Unexpected Returns: Understanding Secular Stock Market Cycles; he also wrote Probable Outcomes.
Here are Ed Easterling’s 12 Rules of Market Cycles:
1. Secular cycles are driven by the inflation rate (deflation, price stability, and higher inflation)
2. Secular bulls occur when P/E starts low and ends high over an extended period
3. Secular bears occur when P/E starts high and ends low over an extended period
4. Cyclical bulls and bears are interim periods of directional swings within secular periods
5. Cyclical cycles are driven by market psychology, illiquidity, or other generally temporary condition(s)
6. Time is irrelevant to the length of secular stock market cycles
7. Secular bulls require a doubling or tripling of P/E
8. Secular bears occur as P/E stalls and falls by one-third to two-thirds or more
9. When real economic growth is near 3%, there is a natural floor for P/E between 5 and 10, a natural ceiling around the mid-20s, and a typical average in the mid-teens
10. If economic growth shifts upward or downward for the foreseeable future, the natural range moves upward or downward, respectively
11. Inflation drives P/Es location within the range; economic growth drives the level of the range
12. The stock market is not consistently predictable over months, quarters, or periods of a few years; the stock market is, however, quite predictable over periods approaching a decade or longer based upon starting P/E
Good stuff. That’s an interesting take on broad cycles.

Best Action is Inaction


Best Action is Inaction

In a previous career, the objective of my trading was to grab as many points or “ticks” as I could out of the day’s trading action.  Generally, the wider the trading range for the day and the greater the volatility, the more money I made.   The action since the beginning of August has been fertile territory for the day trader.  Unless you are a day trader, read on for my own educated advice.
Trying to establish a *position* or fundamental/technical trade in this sawtooth volatility is masochistic.
First, let me say that becoming a profitable day trader is not easy.  You must watch the market at all times and you must learn the discipline to cut losers quickly and let winners run.  At least 2/3 who try to become a day trader will fail and it will most likely take a year or more to turn the corner.  The good news is that a successful short term trader can bring knowledge gained from day trading into longer term trading strategies.
The first obvious and hardest lesson is to get rid of all pride, all pretense of “beating the market”, and to be able to admit defeat quickly by cutting losers short.  The reality is that over short trading periods, you will have a number of losing trades that is nearly equal to the number of winning trades.  The difference between success and failure is cutting the losers short and letting the winners run.  Over longer periods of time you might be able to increase your success ratio, but you still need to exert discipline over your emotions.
The second lesson that can be applied is to never force a trade.  If you watch the markets all day long, you almost feel compelled to be *in* them.  The reality is that you should almost always force yourself to wait until you cannot sit on your hands anymore.  As a daytrader, these compelling opportunities could be once or twice a day.  As a long term trader, these compelling opportunities could be once a year.  It is ok to sit in cash or to have most of your risk hedged away.  Being in cash or net neutral allows you to jump on an opportunity when you believe it looks screaming rich or screaming cheap.  Those who were anxious are most likely sitting on a loser, praying that the trade comes back, and too fearful to double down.
So stop worrying about “missing out” lest you want to get chopped up as well.

Barclays Technical Guru: Sorry, But Markets Broke Down Ominously All Over The Place Yesterday


Fans of technical analysis will enjoy this big chart from Barclays' guru Jordan Kotick who sees signs everyone that markets have broken down in a bad way.
chart

THE BULL BEAR DEBATE


THE BULL BEAR DEBATE – A COMPLACENT MARKET OR A RESILIENT MARKET?

This morning’s Barrons had a good piece by Michael Santoli discussing what he refers to as a market “held hostage” by Europe.  And it very much is.  Mr. Santoli cites the bull-bear debate surrounding this environment:
“The crux of the bull-bear debate today, then, is whether the market’s perseverance is best compared, in boxing terms, to a resolute fighter with an iron jaw or a punch-drunk tomato can without enough sense to go down. This can be a fine and imprecise distinction, and the first condition can morph into the second with one blow too many. But when a market refuses so many perfectly good excuses to collapse for good, its resilience probably deserves the benefit of the doubt.
As put on Friday by veteran market strategist Vince Farrell of Ticonderoga Securities:
“The market seems to handle whatever [is] thrown its way. The Greeks tried to take the system down, but it looks like, as the Spartans of old, they are being carried back on their shields. The Italians are hoping the full [Mario] Monti will pull a bunch of technocrats together and muddle through. U.S. economic news, on balance, continues to improve. Inflation came off the bubble in China and some are guessing the government will ease [interest rates] a bit by the end of the year.”
So, is the market resilient or complacent?  I don’t think it’s either.  For once, the market is acting quite rationally.  The concern in Europe is that the EMU’s leaders will let everything collapse.  This worst case scenario is incredibly frightening from the market’s perspective as it has the potential to cause a 2008 repeat.  So, when the news headlines appear to hint at Europe falling apart the market rightfully craters.  And when the worst case scenario appears to be off the table the market rallies back.  Despite the market’s fairly rational response so far, we are likely to remain hostage to the Euro crisis until a real fix has been implemented.   Don’t hold your breath on that….

12 November 2011

Confused?

November series has been extremely tough for traders, especially for momentum traders who try to follow a trend, play break out and rely on a fast moving market. If you are caught wrong footed on a position or just confused as to what side to take, well welcome to the party.

The prime reason for this extraordinary environment is the increased focus of market and more so the media on news coming out of Europe. None of us know how long this will carry on, but it surely has become a joke to some extent. Things will sooner than later come to a break point when market will decidedly act.

I am trying to see how the Institutional Investor are playing this Market.

The chart below shows FII Index futures and equity action of FII as well as DII. The upper panel shows Long and Short position build up for each day and cumulative as well. The lower shows how much FII and DII have bought or sold in equities.


As seen from the chart FIIs added a whole lot of Longs and got rid of their Shorts on expiry day 25th Oct when Nifty rose by 94 points. They also bought decently in equities, though the DIIs sold it to them. So at this point of time we can expect FIIs are the ones who are bullish and DIIs bearish.

Focus on 28th Oct, when Nifty did a huge gap up and closed 159 points up. FIIs added more longs and got rid of shorts again. They also did a tremendous amount of equity buying, much more than DIIs supplied them. Funny thing to note: that level of Nifty has not been reached again.

The FIIs have since then (till 4th Nov) did nothing significant, except for reducing the longs. And on 8th and 9th Nov bought equity and increased longs, DIIs meanwhile are doing their selling.

Now come to what happened on 11th Nov, when Nifty closed on 5170, over 200 points below the Intermediate top. FIIs are suddenly cutting their Longs significantly and what more there are signs of Short addition. There is not much equity action, but its generally seen that equity action by FIIs lag their derivative action.

So are the FIIs finally given up on their bullish stance? Or this action on Friday just a one day panic. We will get clues for this in the coming week. To make things interesting US markets have rallied strongly on another set of news coming from Europe!

If we see FIIs shifting to bullish mood again next week, we can expect 5400 to be taken out in near future. But if we see the rally in global markets being ignored and sold into by the FIIs, there is a huge chance of this  being another bad series for Nifty. Note how DIIs have not at all shown interest in buying, which shows they are expecting lower levels again. My friends at Vtrender also point out how DIIs sell at market tops.

One thing is for sure DIIs are more sure about what they want to do in this market! FIIs were bullish, but looks like they may change their opinion. Whatever happens, one thing is for sure, these are extremely confusing times and everything depends on how the news flows, which is never a good time to be in the Market.