31 August 2011

Nifty : Cat is Bouncing?

2 days of rally with short covering have definitely cheered the market up. People though cautious are now pointing how much "legs" this rally have. I have been hearing targets ranging from 5300 to 5500. Though not impossible, it looks quite improbable that we will go there without having a scare again!

Its always either the "world is going to end" when stocks fall or "party as if there is no tomorrow" when stocks rally! The importance of level head is ever higher in these kinds of mood. Anyway, what I am trying to say is that, though the Nifty rallied hard in 2 days, its important not to get carried away in the euphoria. There is hardly any change in fundamentals and its just that people got too pessimistic and stocks got too oversold that this rally is taking place. Market never likes people on one side of the trade, I think shorting and making money was getting easier by the day and hence such a rally was necessary!

Coming to technicals, and doing pure price analysis, what I feel is that there has to be some kind of bottoming and consolidation, before we can say that, the bottom is in place. There has to be atleast a  "higher low" to get a confirmation of it.


Above is the daily chart of Nifty from November 2010 high, and I have marked 3 earlier slides in Nifty and the "basing" it did after those ended.

The 1st and 2nd basing are quite similar, after the relentless correction, you see a strong rebound, only to give up almost all the gains in quick time. The rebound sees oscillator to get into overbought zone and the next leg of correction brings it back to the oversold territory. We also see a lower negative momentum when Nifty falls back.

The 3rd basing is quite different, as after the initial rebound Nifty makes a new low, though with lower negative momentum. Which is generally called positive divergence. The oscillator though gets deeper into oversold region.

The current rebound is only 2 days old while all previous tops have been made around 6th to 7th day. It has already done roughly 30% of the correction. Another point to note will be that this correction has been with the highest momentum since the November Top. Keeping all these factors in mind, I feel that we have some more days of rally pending and going by the average 40% rebound, we should be somewhere around 5100-5150 before this rally fades. It would be interesting to see if we make a new low or a higher low. Going by momentum of fall, I feel we can make a lower low. Lets see how this plays out, but one thing is for sure, expect a lot of volatility and whipsaws in near future!

28 August 2011

Sure Thing?


There was a post called Benner-Fibonacci-Cycle earlier. I found an equally good variation of it on the internet and wanted to share with all of you.

The chart is self explanatory but still I would like to write (just in case its not entirely readable) a few lines regarding the 3 rows of years pointed out. Row A are the years of panic not necessarily the year of market top. Row B are the years of Market Tops (time to sell) and Row C the years of Market Bottoms (time to buy). The calculation formula is also there in the chart, but I have no idea how to support it.

As you can see this chart has been prepared in 1872, so you can go back in history and check the validity of prediction here. Last few panics were in 1981 and 1999 and the next is expected in 2019!

Market tops were in 1999 and 2007 and next predicted is in 2016.

Market bottoms were in 1996 and 2005 and next predicted in 2012 (Oh No, Not Again!)

So looks like I have 1 more year to sit out of equities!

Nifty : Market Cycle

I have tried something, through which we can try to forecast a Nifty "Local" High/Low time frame. Its more of an effort to find out what kind of Market Cycle do we have in Nifty.

For it, I have taken all data for Nifty and created a table for monthly average closing price since July 1990 till July 2011. Then I tagged a month  "High" depending on whether the preceding and following months are having average prices lower to the current month and very similarly tagged a month "Low" in case it has preceding and following month average prices higher to the current month.

Though this is not a very correct way, I saw that it can fairly accurately "catch" the month which has the genuine High or Low. The other point to note here is that I am only focused in capturing local highs and lows and not major bull market highs and bear market lows. So you will see that the occurrences of Highs and Lows are quite frequent in this model.


Above are the charts for the local Highs and Lows made by Nifty since July 1990. First focus on the left chart titled "Highs"; the X axis is the interval in months between consecutive local highs in Nifty, the Y axis is frequency. So this chart can be interpreted as - there are 4 occurrences in the entire dataset when Nifty made consecutive highs at the interval of 2 months. For example if Nifty made a high on Aug 1995, it made another high on Oct 1995.

Coming to the charts we see that the maximum frequency  is at 3, but 4,5,6 months interval are also quite substantial. Above the chart I have pointed some other figures, which says Average is 4.88, Median 5 and weighted average of 3.72.

Similarly if you look at the chart titled "Lows", you see a peak at 4, though 2,3,5,6,7 all are having weightage. The Average is 4.9, Median 4 and weighted average 3.77.

The recent data says that Nifty made a Low in Jun 2011 and a High on Jul 2011. I need to dig this deeper, to make any sensible forecast, but I wanted to get this out so that I can get more inputs to work on this track.

27 August 2011

Nifty : Pessimism for a Rally?

After Friday's selling, mood has definitely turned for the worse. Lower targets from "analysts" must be coming up on TV. Checking the charts it looks to me that wave 3 is finally coming to an end! It has done tremendous damage to prices, erasing 1000 points in exactly 1 month from Nifty. Apart from that the damage to chart and sentiment has been extreme. To get back into bullish mode a lot of work has to be done.


The above hourly chart shows that there are divergences developing in RSI and MACD, with oscillator also in oversold region. Though none of these are a guaranty that Nifty will rally, but there is high probability that Nifty will not fall further, or may even rally to get rid of these divergences.

Now if there is a rally or a sideways consolidation (which also will start with a rally), we can expect Nifty to target 4950-4960 atleast which is both 23.6% retracement as well as resistance from where Nifty turned down. Next target of 5100 (38.2%) is also well within reach and my preferred target.

Wave 2 (from 5500-5700) was a deep correction, so wave 4 which we are expecting to witness should be a sideways move, which means we can see some kind of triangle or rectangle developing for next 10-15 trading days.

26 August 2011

Nifty : A September Bottom?

I wanted to get this out earlier, just after expiry of August series, but time did not permit. If you recall PCR Cycle post, I showed how Nifty looks to be following a PCR cycle.


Above image shows the Nifty and PCR updated till August Expiry. I have marked Jan, May and August series. The similarity in all the 3 series here is that PCR and Nifty showed continued weakness right through the series. Interesting to note is that Feb and June series (series next to the downtrend series) marked the swing bottom. Going by the same analogy will we see a bottom in September?

There are few more insights that can be taken from this chart. Will look into it when time allows. Or better why don't you try to get some!


21 August 2011

Nifty : Corrective Path

Last Four Weeks have been a forgettable one for Indian Investors. Nifty has dropped from 5700 to 4850 roughly in that time period. It roughly corresponds to 15% which is huge for an investor, who at times tries to gain that much in a good year! So for anyone invested in market especially who are directly invested, it must be have been really painful.

Without further delay lets get into the technicals and see if the pain is anywhere in the end. Firstly we should get very clear about the fact that this is the largest correction since October 2008 lows of 2250 and hence not a "healthy correction" towards making new highs. It will atleast do a minimum 38% (very bullish) to 50% correction (standard) retracement of the entire 2250 to 6350 rally. If it has some relation to the 2008 correction then we should expect Nifty to test 2250 again (Flat ABC correction) or come very close to it or break it (irregular flat correction). In extreme case if it has been an end to a long term bull market as described earlier here http://technically--speaking.blogspot.com/2010/11/nifty-long-term-view.html then hold your breath!

I am presenting two most likely scenario, which assumes that Nifty has ended a bull wave from 2250 to 6350 and is now retracing it. This is bullish because once this thing ends Nifty will be on course to make new highs.

The first and most likely path Nifty can take is presented below in the chart.


As mentioned in that chart, just a 38% retracement is almost out of contention, we can have a 50% or even deeper correction.

The latter and more bullish path is shown in the chart below. Where Nifty is in its last stages of correction and should start bottoming process now. Which basically would be some counter trend rally, another fall with less momentum, thus creating divergence. Hitting a target of 1.62 times wave A which is around 4530.


To be honest, though I will keep these scenarios in my mind, I don't think they will make a real bottom. I am pretty sure with either of these scenarios playing out there will be significant rallies. But they will soon fizzle out, they would be more of short covering and technical rallies which would just create more possibility of further fall. The reason I am saying this is because of the time taken.

In a bull market (long term charts of any price action), we see long periods of prices moving upwards, interrupted by shorter sharper corrections. Corrections by nature itself is violent and short lived. Just an example is how Nifty crashed from 6350 to 2250, all in 10 months of 2008 (4100 points in 10 months)! By comparison it has been 8 months now and Nifty has done only 1550 points. Which certainly means this correction looks to be a lot slower and has the potential to be the primary direction of markets for years to come. Will do some more finding on it. Till then be safe!

15 August 2011

Nifty : Gap Down History

I did some historical data lookup to see what follows when Nifty Gaps down big, like it had done recently. So I scanned data from November 1995 (this is what NSE provided me) and looked for days with gap down of 2% or more.

Interestingly found only 9 instances of it, 3 of which happened on 3 consecutive days of this Month! Never have this happened earlier. The only time we had 2 consecutive 2% gap down days was on 31st March and 1st April 1997!

Of the 5 clusters (check table below), 2 instances are of where Nifty actually closed higher 5 days hence the last gap down day. The 1997 instance when Nifty gapped down 4% and closed 8% lower, also shows a cut of 2% at the end of 5th day. There are 2 instances when Nifty closed 5th day with cut of 6% and 2% at the end of 5 days.


Though the sample is very small and, the current situation is different we can approximate it closest to the 1997 panic. Where Nifty after the initial few days of losses tends to recover almost all. Now also I feel Nifty should be bouncing from these oversold level.

14 August 2011

Nifty : Breadth Oscillator View


Nifty : Crystal Gazing

I am a great believer of market cycles, symmetry and fractals. I always try to look for them whenever I look at a chart. Lately the price action of Nifty has shown something to keep me interested.


Look at the chart above, and as I have marked check the fall from (I am being rough here) 6350 to 5700 and then from 6200 to 5200 a roughly 162% expansion in twice the time. This calls for the perfect A vs C symmetry in terms of Elliot Wave Theory.

Now comes the difficult and debatable assumption, which is if the fall from 6350 to 5200 which ended in February is an ABC correction, the fall from 5900 is also an ABC correction, a typical zig-zag correction. Of which we are in wave C and hence should expect some kind of 5 wave formation (from 5700 top).
If we again assume wave A and C symmetry, I expect wave C to be 24 weeks in duration, 6 of which have already passed and length to be 162% expansion of wave A, which gives us a nice target of 4500.

So if Nifty which is already a tad above 5050 have to take another 18 weeks to go down a mere 550 points, what should happen?

13 August 2011

Nifty : An Observation Part 2

Just a follow up to the 1st April Post.


If Nifty is not able to hold on to the central sloping down trend line, the fall in the market will get even more severe. Obviously we will have some more supports, but this is something to be aware of.

Nifty : Will the Gap get Filled?


Another things which I would like to mention is the Gap between roughly 5230 to 5330, if markets, majority of which is dependent on Global gets into bullish mode, Nifty though after facing resistance around 5250 can target 5330-5350.

My undertone is bullish, because of the fact that there is a lot of fear that has suddenly crept into the system and people are not even willing to carry position overnight. This mentality needs to be changed before more fall can be expected.

09 August 2011

From : Humble Student Of The Markets


Big down days on the DJIA

CXO Advisory wrote about what happens after big down days on the S&P 500. Their study dates from January 1950 and they defined "a big down day as a decline of at least four standard deviations of the daily returns over the preceding four years (1,008 trading days)." They found 45 observations and concluded that:
  • The average next-day return is 0.59% (but variability is high).
  • 60% of next-day returns  (27 of 45) are positive.
  • The average next-day return is fairly consistent for subsamples when the index is above and below its 200-day SMA.
CXO went on to warn that the results were very volatile and 45 days is a relative small sample upon which to reliably draw conclusions. So I repeated the study using data for the Dow Jones Industrials Average, pulled from Yahoo Finance. That data goes back to October 1, 1928 - though if you average four years' worth of data, you missed the Crash of 1929. Here are the results:

DJIA 4-Std Dev Big Down Days

Markets rallied the next day but fell back in a week
I found similar results, though the sample size was slightly larger at 59 (instead of 45). The next day return averaged 0.36%, which beat the average daily Dow daily return of 0.03% by 0.33%. There was an outlier of -22.6% during the Crash of 1987 which pulled down the average return. If we were to look at the median return, which is less sensitve to outliers, the median daily return on big down days was 0.43%, which was substantially ahead of the Dow daily return of 0.04%. 62.7% of the subsequent daily returns were up, ahead of the 52.2% figure for all Dow days from 1928. Next day returns were highly volatile and the standard deviation of daily returns after big down days was nearly four times the standard deviation of daily Dow returns for the entire sample.

CXO Advisory warned against looking at averages of subsequent one-week returns because of overlapping instances of big down days. The table reflects the first instance of a big down day in a five day period and subsequent big down day weekly returns were ignored.

Interestingly, while the markets rose for the next day for big down days, the one-week return was not so encouraging. In all cases, the average and median returns, as well as percentage of positive weeks, underperformed our control sample of the Dow returns for our entire study period.


Monday was not a 4-standard deviation day
Despite the market carnage yesterday, Monday did not qualify as a 4-standard deviation day. The measure actually came in at -3.48. So I repeated the exercise by defining big down days as 3-standard deviations under the 1008-trading day average:
 
DJIA 3-Std Dev Big Down Days
 
Here the sample size grew to 170 from 59. The results were similar but not as strong. The one day return outperformed but the one-week returns were mixed.

06 August 2011

Nifty : Following PCR Cycle?

Have found something worth a look in one of the charts. Was about to post it earlier, but looks like the longer I am waiting the closer it is getting to comfort!


Above is the chart of Nifty Put Call Ratio (PCR) and Nifty Future adjusted to near term expiry. The vertical lines are the expiry dates. First focus on the March, April and May series PCR, tagged as 1,2,3 in the chart.

What we see is that PCR for March opens decently over 1, moves flat, corrects to around 1 and then spikes to over 2 closer to expiry. Clear signs of an oversold market consolidating and basing and rallying along with short covering.

April expiry is quite boring, PCR remaining over 1 for most of the time but expiring under 1, Nifty doing it bit of movement but showing signs of distribution (PCR pulled lower by the end of expiry).

Now see the May expiry, Nifty starts on a weak footing and straightaway loses the plot. PCR consistently moves lower towards 0.5 and Nifty takes it on the chin.

Now, what is so interesting about this formation is that firstly it clearly shows how PCR can be helpful in tracking what Nifty wants to do and secondly it looks like this cycle is repeating again! Check the June and July expiry which shows ominous similarity to Match and April in terms of PCR and PCR trajectory. Also August is already following May footsteps!

If this is to be believed we are in for some nervous consolidation, followed by another fall. So the targets of 5000-4900 doesn't look too pessimistic for this series, which mind you is only a week and a day old!

This study also points us to the market cycle principles. What nifty is doing is mostly following a bear market cycle. Which is to correct, consolidate and rally (though less and distribute) and correct again. Had this been a bull market we would have seen a different form of this cycle which I believe would be rally, consolidate and correct (though less and accumulate) and rally again.

It would be nice to see if Nifty does follow this pattern, or has something else in mind. In any case it would be great to revisit this chart in few weeks time!

02 August 2011

Nifty : Reversal Signs Emerging?


J.C. Parets : India Nifty 50 in a Healthy Consolidation


Its nice to see some leading market technicians comment about our very own Nifty! Here is JC Parets commenting in his latest post.
The Nifty 50 is the leading index for large companies on the National Stock Exchange of India. We want to look at this index as a leading “risk-on” indicator. When money wants to be aggressive and feels confident that buying equities is the right thing to do, you’ll probably see money flowing in this direction. The opposite is also true. Look at the destruction of the Nifty 50 in 2008 when money was trying to be a conservative as possible:
After making all-time highs in early 2008, this benchmark of India got clobbered. But look how quickly it recovered throughout 2009. Look how the Nifty 50 put in its lows well before the US indexes made their lows. This is easily one of my favorite leading indicators.
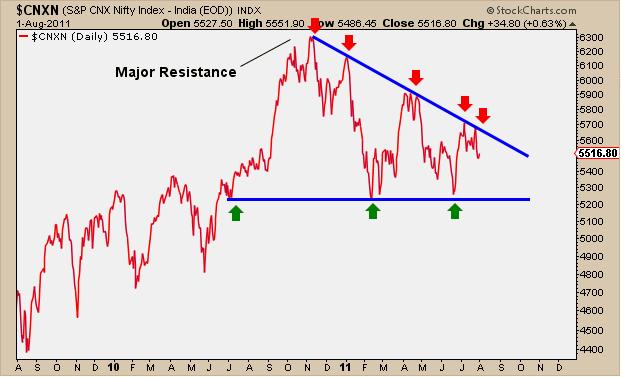
Late last year, India managed to come all the way back to test those 2008 highs. The market has memory here guys, we cannot possibly expect this index to break through there without at least a little consolidation. I know a lot of us are impatient, it’s just human nature, but come on, give this index a break. The descending-triangle like formation that we have seen here over the last 10 months is perfectly normal. Here is a closer look:
We have a declining trendline up top with a flat fixed level of support down below (5200 or so). On a breakout above this descending trendline, I would expect a retest of those all-time highs. Again, be patient – don’t think it’s just going to break through and never look back. Expect it to chill out a bit before making it’s next major move higher.
The bottom line is that the Nifty 50 still looks good. Buying on weakness is probably the right thing to do. Any action below these key support levels would force me to reevaluate our position. But as of right now, this action seems normal and constructive.