30 June 2011

Nifty : June Expiry

I am doing this post especially for the F&O expiry due today. This series has been a long one and Nifty has gone from 5600 to 5200 and then back to 5600! Its one of those rare series where the Market does a full circle.


Anyway coming to the developments for this series, as you can see the 1st quadrant shows the option build up till yesterday. The 2nd quadrant shows the max pain picture, while the 3rd shows it in more detail. One thing very clearly comes out is that all action will be around the 5600 pivot. Max pain shows that we can expect expiry around 5550 level, but we things can change drastically even on the last hour of expiry as we all know.

What adds some twist to all the observation is the amount of 5700 CE addition, which can be seen in the 4th quadrant. Over 2.5 million shares added on the last day, when it was quoting around 2 to 3 rupees, points out to some major buying interest. Some player/s have spent 5-8 million rupees in buying lottery tickets.

Now the question is, whether this is some sort of gamble someone is playing on expectations of a massive short squeeze, remember for this option to be of any worth, Nifty should be closing above 5700, ideally over 5710 (a 2% rally)! Also as there has been increase in OI of this CE, someone must have obliged the buyer by selling it. Surely, probably, statistically this 5 to 8 million rupees looks to be easy money for the writer, but he faces massive losses if there is such, not exactly a white swan event.

If we look at the charts, chances of a correction are much higher, as Nifty is overbought and showing divergence in short term. But short squeeze is something which can never be ruled out. In my opinion Nifty should be jumping around a lot today, satisfying option buyers and sellers of both 5500 and 5600 strike prices and who knows even 5700!

Point to be noted would be that a good opening over 5600-5630 would certainly be in bulls favor and remember Nifty hardly spent anytime in 5600-5700 region while coming down, so the resistance in this area if at all would be weak.

28 June 2011

Nifty : How Much More?

As expected, in my 18th June post, when things became far too obvious, that market's only direction is and should be down, it made a killer move. After spending only 3 days below 5300, it bounced back hard. The last 3 trading days has seen roughly 240 Nifty points gain and doesn't by any means looks it can go any lower from here! Atleast the momentum is so high that anyone trying to change its direction would surely be swept away!


Getting away with metaphors and coming back to real world, which is charts in our case is nothing else than picture perfect for bulls. There was numerous divergence created, MACD being the most easily identifiable. Nifty touched 5200 in the "Mauritius Panic" and took tremendous support (generally these panic lows are always retested) and have rallied over 300 points from there. The "big white candle" of Friday not only killed all the shorts, it also killed a lot of negative sentiment. People predicting 4800 should surely hide their faces!

So what should we be expecting now? As pointed in the chart, there are 2 big resistances coming on Nifty's way. 1st the minor 5600, which had been broken only once since the November 2010 highs. Then the major, the downward sloping trendline. In my opinion, looking at the current momentum and F&O expiry, I feel 5600 would be the near term resistance to work with, so I don't expect expiry to be much higher than 5600. The beginning of July should see, Nifty struggling (by no means weak) around the red circle marked in the chart.

If this resistance is taken out, 5900 and 6200 are the levels that can come into the picture, but I would say those will hardly be a stumbling block and we would most probably see strong rally to challenge the November as well as all time highs.

If Nifty falters around the red circle, expect retest of 5200 panic lows. My personal opinion is of the 2nd scenario, where Nifty hits the downward sloping trendline, falls back to 5200 to complete leg E of a descending triangle which is wave 4 and then rally sharply.

I will enjoy this rally, but I will be cautious around 5600-5700 with my longs and should be ready to convert them to shorts, just in case we get too optimistic at 5700.

24 June 2011

Courtsey: All Star Charts


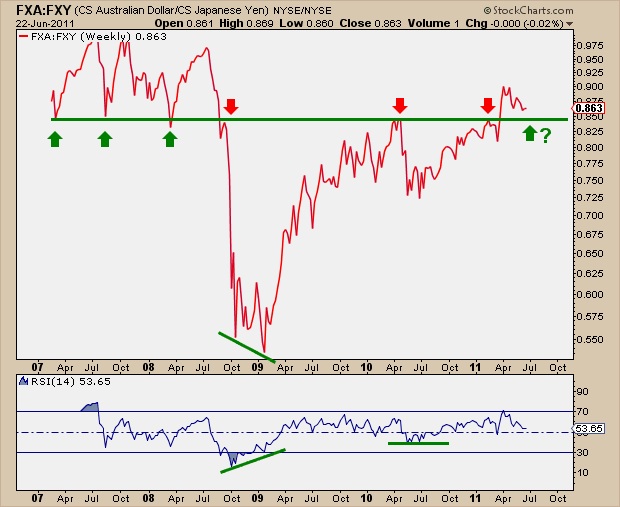
Exactly one month ago I put up a chart of the Australian Dollar vs the Japanese Yen ETFs ($FXA:$FXY). When looking at this ratio with the S&P500 behind it we can see the positive correlation immediately. When the Risk-On trade is dominating trading desks around the world, money flows into the Aussie Dollar and out of the Yen. When the Risk-Off trade is on then the opposite is true. I wanted to put up an updated chart of this ratio in order to show how critical of a level we are currently testing:
What was clear support throughout 2007 ultimately broke down with everything else in 2008. This same exact support level became Resistance on the way up in 2010 and again earlier this year. The $FXA:$FXY ratio broke out in the spring and is currently testing this key area. A successful test here should bode well for US Equities, while a breakdown would signal that this move was false giving us a heads up that the Risk-Off trade will be dominating the markets until further notice.

19 June 2011

Nifty : Volume Study


18 June 2011

Nifty : Charts telling a Lie?


I have been fiddling with my charts for some time. The above Nifty weekly chart has been labelled with what I can say a intermediate term bullish structure. But the fact that it has an ABC marking, tells us that this rally from October 2008 will end soon.

I am not going into the details of %age retracement and time taken by corrective waves. But as of now it looks quite acceptable. So I will definitely keep this count at the back of my head, if things started getting bullish, which I feel right now is so unthinkable, which makes it quite possible!

The labeling of wave A, is picture perfect, bullish guys will count it as wave 1. After that we have a 3 wave irregular correction. And then we see the start of a possible 5 wave C wave. I have shown in the chart that how the current 4th wave is overlapping with wave 1st of C (which makes this wave nothing other than C, bulls would have counted it as 3) Its a very different story if wave 3 is sub-dividing here.

Keeping this count in mind, we can say that we are still pending with some more time of compression. Wave D and E of wave 4 are pending. We can expect D to hit 5700 and E to end above 5400 and then see a 5 wave rally to test earlier highs and all time highs of 6350.

Some of you may ask as to why all of a sudden I am getting bullish. Once I put on my trader hat, I forget all what I have said earlier and did earlier. I need to believe what I see, and be flexible enough to to go from -100 to +100 and vice versa.

So when pessimism is all around you, you have counted infinite reasons for market to crash and placed bets for the end of world. It will cost nothing to have an exit plan, when the universe schemes against you, the market sets a trap and even the charts tell a lie, suddenly you see markets screaming higher for no reason, and all those infinite fears resulting in another short squeeze.

04 June 2011

Nifty : What Clouds Predict?

Its been around a month since last update, but nothing dramatic has happened in my absence! Nifty from 5600 in 2nd week of May fell to around 5300 and then bounced back to 5600 last week, but Friday closing was disheartening for bulls as Nifty could not close above crucial 5550, a short term pivot.


I am starting with a weekly view of Nifty, which looks to be precariously poised above 5200-5400 support area. As we can see the cloud support has been breached and the upmove has been very weak and heavily resisted by the clouds above. The sell signal is still working (the blue line is lower than the red). So the dominant message coming out is that Nifty is weak and selling would take the limelight in coming weeks and months.

As pointed in the chart 5200 to 5400 support area should come into play pretty soon and if that does not provide the necessary help needed by Nifty, we are bound to see some serious bull massacre. The next zone of support comes only around 4600 to 4800 area. The 200week moving average is also located at 4800, so that becomes the natural target as well as support once 5200 is taken out. Obviously I am not telling Nifty will fall straight to those levels, 5000 would be a good round number support. And oversold oscillators along with divergence will give us some sharp rallies in between (mostly short coverings).

Now, what could trigger such a fall from current 5500 to 4800? As the recent news coming from global front suggests, there could be a whole lot of them. We are having Euro debt crises, serious questions on US growth expectations which as pointed out by economists have been only due to money printing, MENA unrest has taken a back seat but can emerge again at any point of time shooting up the crude prices and stoking inflation fears. I believe in the cockroach theory, which tells bad news comes in chunks, so I would be expecting these as well as some more new themes.

I have taken clouds lightly and paid the price, so trust me when clouds on weekly time frame says sell. Last time this (price below cloud in weekly chart) happened was in July 2008. Also price has never broken the cloud support since the March 2009 rally.