The History of Unfilled Gaps in the U.S. Stock Indexes
- Posted by PeterLBrandt
- on September 5th, 2011
There is a chance – a very good chance based on late Sunday and early Monday trading – that a down gap could occur on the daily and weekly U.S. stock index charts when they officially open on Tuesday morning.
If a down gap occurs, it could prove to be an historic breakaway gap that might not be covered for months (or even years). Such a gap would leave stock market bulls stranded.
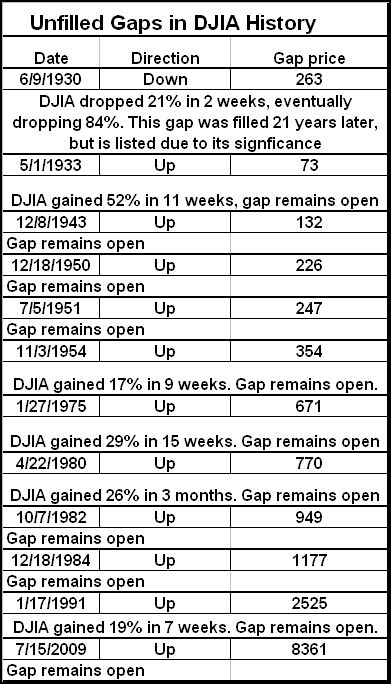
Uncovered gaps in broad indexes such as the DJIA are EXTREMELY rare. In fact, (by my count) over the past 80-plus years there are only 11 uncovered gaps in the DJIA. Reflecting the historical growth of the equity market, 100% of these have been up gaps. Not a single uncovered down gap exists. [Note: A down gap on June 9, 1930 resulted in an 84% decline and remained uncovered for 21 years.]
A tabular listing of the uncovered closes in the DJIA follows.
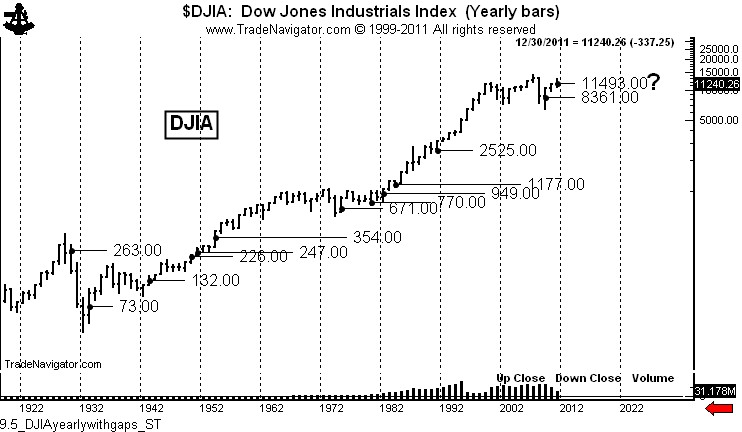
It is imperative to note that these 11 gaps appeared at crucial points throughout the years, as shown on the yearly chart below.
A price gap is when the high of one day is lower then the low of the next day (up gap) or the low of one day is higher than the high of the next day (down gap). Gaps do not need to be large and gaping to count.
Technically, there are four different types of price gaps.
An area gap is the common type. These gaps occur frequently within a broad price range and are typically filled within days or weeks, although in some cases an area gap may not be filled for months.
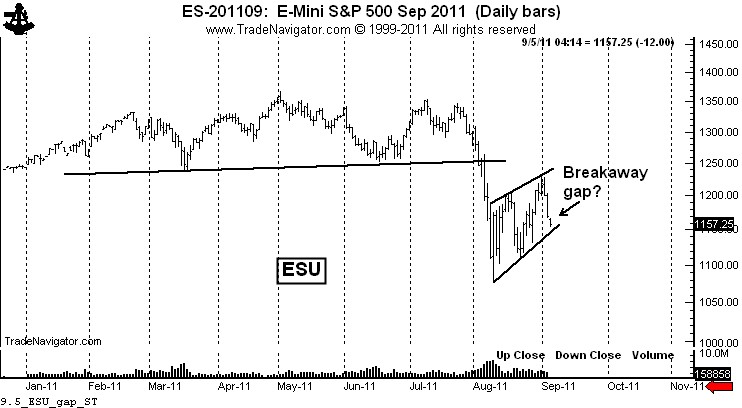
A breakaway gap occurs in the very early stages of a major price trend. These gaps are initially interpreted as area gaps. Only after a sustained trend does a chartist recognize the breakaway gap for what it was. Tuesday’s upcoming down gap (if it occurs) could be a breakaway gap.
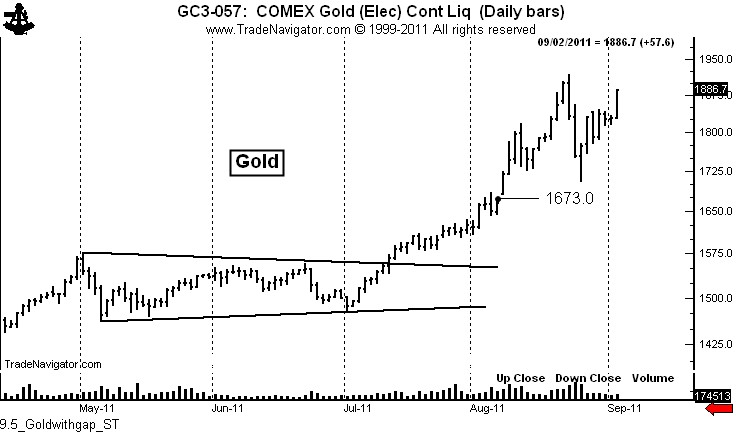
Measuring gaps occur during approximately the half-way mark of a strong price move. Measuring gaps are also referred to as “half-way” gaps. A recent example of a measuring gap occurred in Gold on August 8. I posted a blog about this gap on August 10, titled, “Want to know what gold is going to do – the key is the August 8 gap.”
I pointed out in the post that the gap projected Gold prices to 1872. Gold was at 1730 at the time of the post.
Finally, exhaustion gaps occur very late in a trend. When they are filled it is a sign the trend has run its course and chartists should look for confirming signs of a trend change.
As a basic rule, gaps of all types are more frequent in individual stocks and commodities than in broad averages. Thinly traded stocks and deferred futures contracts especially are loaded with gaps to the point that gaps are meaningless. Chartists should only pay attention to gaps in broad indexes and the most widely traded stocks, commodities and forex pairs.
Are there any reasons to believe that a downward gap in the major indexes on Tuesday could be a breakaway gap? You betcha! Consider the following:
All of the broad stock indexes have a H&S top in place. I cannot believe how other traders are pooh-poohing this top. Tops like this come around only a few times in the entire career of a trader. Yet, everyday I read or hear about another “chartist” playing for a bounce. I find this to be just unbelievable. It is a sign of the extreme short-term nature of the markets when “chartists” pay more attention to 10-day RSIs than to a 6-month H&S top.
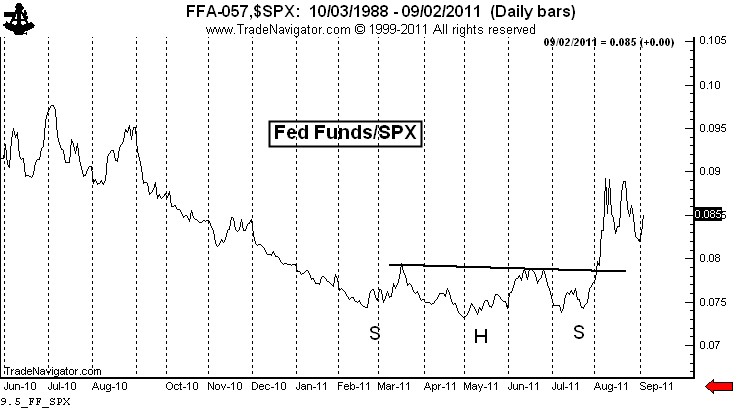
One reason for the skepticism about the current bear market is the natural bias of most traders toward the long side of things. Many traders doubt the H&S top in the stock indexes. Yet, the same traders would be bullish about the chart below. This chart is an inversion of the S&Ps (actually, it plots the Fed Funds rate divided by the S&Ps – close enough). If as a trader you would be bullish on the chart below, then you MUST be bearish on the stock market.
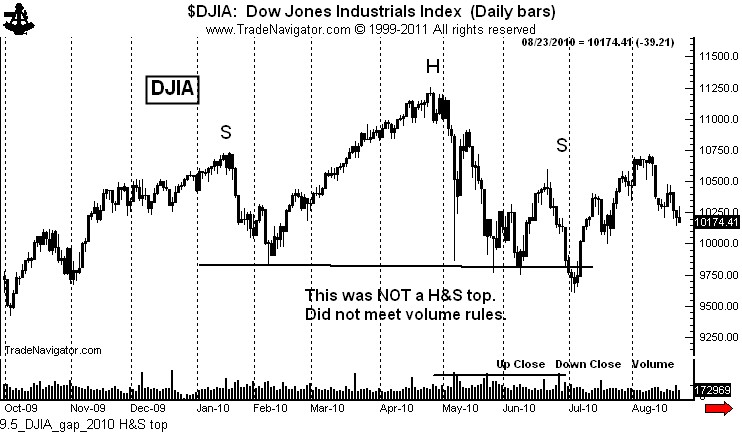
Another reason I hear for the skepticism of this current H&S top is that a similar H&S top in the indexes failed in 2010. Not the same, folks! The H&S top in 2010 did NOT meet the volume requirements of a H&S pattern specified by Schabacker, Edwards and Magee. The “H&S” top in 2010 was not a H&S that failed – it never was a legitimate H&S pattern.
Note on the chart above how the 2010 pattern had the heaviest volume in the right shoulder. This disqualified the 2010 configuration as a H&S pattern. Sorry, Charlie! Chart patterns have rules that must be followed. I continue to be flabbergasted at various formations identified by “chartists” that don’t come close to meeting the requirements of the patterns at issue. Folks, the Edwards and Magee book is considered to the bible of charting for a purpose. Read it. Study it. Learn it.
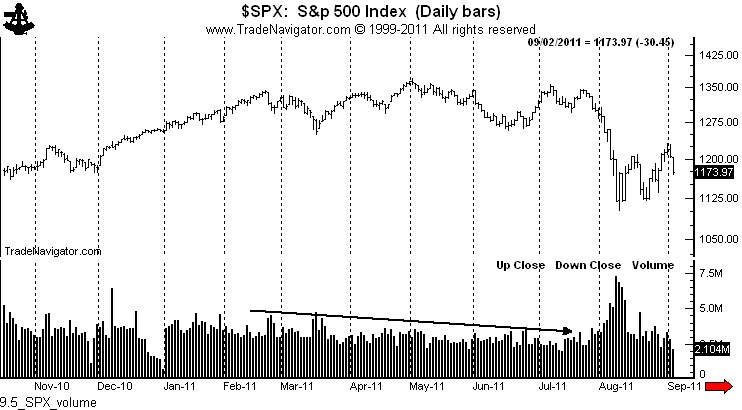
In contrast, as shown below by the chart of SPX, the volume profile of the recent H&S pattern was textbook perfect, heaviest in the left shoulder and head, lightest in the right shoulder. The fact that volume expanded at the breakout only further solidifies the H&S interpretation.
By the way, note the huge volume expansion on the chart above in August. Huge volume is either starting volume or stopping volume. My bet is that this is supply entering the market — and that is not bullish.
A second reason to expect a down gap on Tuesday is the 4-week flag that characterizes all of the major indexes. The declines on Thursday and Friday indicate that the flag is ready to be completed.
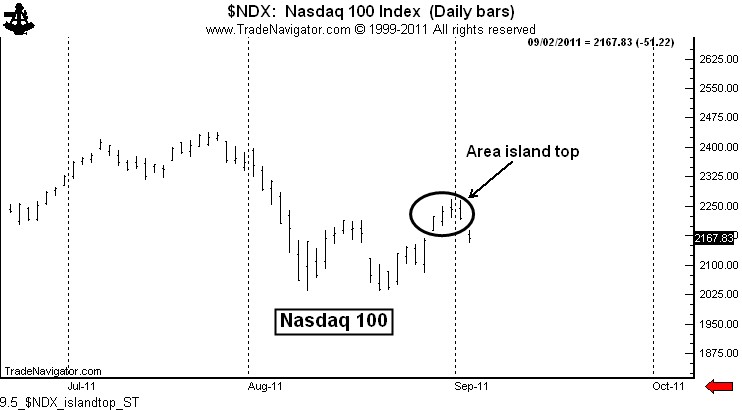
A third reason to expect a down gap on Tuesday in the major indexes is the fact that the spot Nasdaq 100 Index completed a 4-day area island top on Friday. Island tops, if not filled within days, can be extremely powerful indications of a pending price thrust.
What would be the practical and tactical implications of a down gap in the stock market? Quite simply, a risk that the gap is not quickly filled would represent an asymmetrical reward to risk profileof incredible magnitude.
Friday’s low in the DJIA was 11,211.35, closing at 11,240.26. As I write this post on Monday AM (3:34 MST) Dow futures are trading 97 points lower. If things do not change (and they could), the spot Dow would gap down to 11,140, a gap of 70 Dow points.
Many traders play a game of “fading” opening price gaps. If a gap occurs, these traders will go long, expecting the gap to be closed. Talk about playing with fire! These traders will, no doubt, be comforted by the release late week of the CFTC Commitment of Data Reports, showing that commercials have been huge buyers during recent weakness. In fact, commercials have not been as long since ….. May 2008 (wow, that is comforting). If the market gaps down on Tuesday and IF the flag is completed next week, I would define the huge commercial long interest in this way: “Holy capitulation, Batman.”
Let me close this post with a few words to the growing choir of my critics. In the “good olde days” at the Chicago Board of Trade, upstart traders needed to prove themselves before talking smack. How things have changed! Now all a newbee needs is an internet connection, one or two good trades (or success with a paper-trading account), an opinion and a big ego.
First, I am not doom and gloom on the stock market. I could care less whether the market goes up or down. In fact, the most profitable single trade in my career was on the long side of the stock indexes. I have a sentimental connection to a bull market in stocks.
I do care if I am on the right side of whatever direction the market goes. My comments on the stock market have been limited to accepted classical charting principles and price goals. I have not editorialized on the state of the economy or anything of the like. The charts are what they are – and until they change I will continue to shout “look out below” from the highest roof top I can find (like the rooftop in my “dead cat bounce” cartoon).
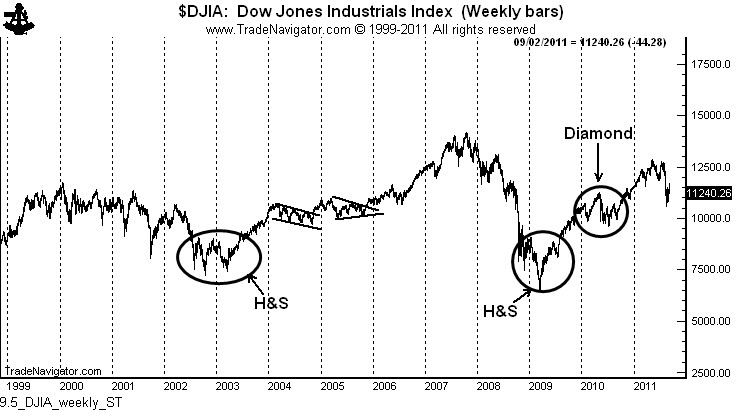
Every major advance in the DJIA in the past decade has been ushered in by a classical chart pattern, as shown below. There is no basis in classical charting to call for a bull move in the stock market presently. There could be in the future – but there is nothing on the weekly chart to launch a bull move
Second, whenever I make a comment on a POSSIBLE chart pattern that fails to materialize, the children’s choir is quick to point out that I am “wrong.”
Three things need to be understood about classical charting principles (read carefully, kids):
- Charts are constantly morphing as one pattern fails and turns into something bigger and different.
- The development of chart structures is an organic process. A chart (especially an intraday or daily chart) may lean toward an interpretation one day and another interpretation a few days later.
- Classical charting principles cannot be used to define all the market all the time. Massive moves can occur without any clue from the charts.
I am much more interested in being profitable than in being right. Believe me, as a trader since 1981 I have eaten more humble pie than you can imagine. I have very little ego need to be right in a market prediction. But, let me add that I don’t think I am wrong on my analysis of the stock index charts. We are in a bear market. Whenever the market rallies I believe it is winking at you.
One of the choir boys made a major fuss last week that my initial prediction for a bear market correction in the form of a rising wedge was incorrect – that a flag would have been a better call. Get a life!. I am continually amazed at all the faux technicians out there that have not figured out the difference between a market analysis and opinion on one hand and risk-controlled trading operations on the other hand.
Another one of the young male sopranos took exception to a statement I made that the U.S.stock market has done nothing for 10 years – he claimed I was wrong because some tech and mineral stocks have skyrocketed. Again, get a life.
So, now at 4:05 AM, here is where we are:
The Sept. S&Ps have gapped lower. If this gap holds, it will be a weekly gap. If daily gaps are potentially important, weekly gaps are history if they remain unfilled.
A bear flag is pending – of course, a bear flag is NOT a bear flag until it is completed, does not fail, and then runs to its target.
0 comments:
Post a Comment