Lessons from seven weeks of stock market chop
- Posted by PeterLBrandt
- on September 30th, 2011
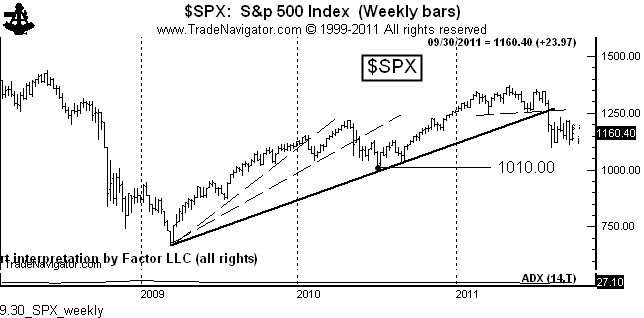
For those of you who wish to gain knowledge in classical charting principles, the choppiness of the past seven weeks in the U.S.stock market indexes offers some excellent lessons.
Let me meander through these lessons, not necessarily in a sequential order.
First, this choppiness has likely to have been financially punishing for those who missed the initial major thrust from late July through August 9. Why? Because the natural inclination of human emotions is to trade yesterday’s market. Feeling as though one had missed out on such a massive move, a trader would press the issue expecting the market to offer a second chance.
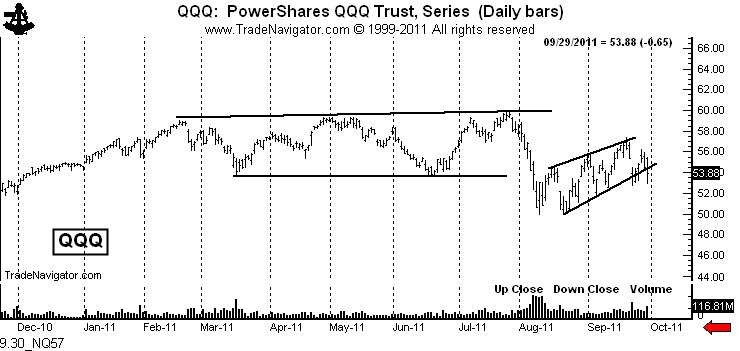
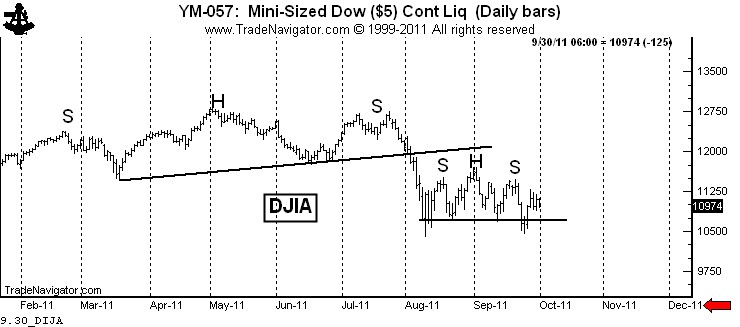
Second, corrections can become complex. Charts that enter trading ranges tend to morph from one pattern to a larger pattern. What looked like a small retest wedge in the Nasdaq 100 on August 17 turned into a flag by early September. A completed flag in the S&Ps on September 12 quickly failed and reversed. A possible continuation H&S completed by the Dow on September 12 also failed to materialize. A possible intraday secondary completion of a bear channel in the Nasdaq on Thursday quickly reversed. Morphing is the norm for range bound markets.
It is important to add, relative to point number two above, that at no time was the range resolved. There were many smaller possible patterns within the range, but the range was never violated. Playing smaller patterns within larger patterns (often with hourly charts) is dangerous territory.
Third, and some of you might have burned on this one, selling a period of weakness or buying a few days of strength within a range-bound market is a losing bet. If you write one new rule onto your ever lengthening rules list, make it this one. Reversion to the mean is the norm for ranges. Within ranges, if you have to trade (which you should not have to do), sell at the upper end and buy at the lower end until the range has been resolved.
Fourth, the wedge in the Nasdaq, the flag in the S&Ps, the pennant in the S&Ps and the channel in the Nasdaq were all “diagonal patterns.” Readers of my book will understand this concept. I generally hate diagonal patterns, defined by boundary lines that slant. Diagonal patterns are the worst characters for morphing. Horizontal boundary lines that account for all of the lows within a congestion (the continuation H&S in the Dow did not do this) are what you want to look for.
Fifth, there are several MAJOR dangers to trading within a range-bound market.
- Getting chopped up within the morph can make you gun shy when the real breakout occurs.
- Range bound markets tend to force a chartist into violating his or her trading rules.
- A compulsion for being pre-positioned for the “next” big breakout can result in a trading becoming obsessed with a market. This is never good. You should never feel as though you have to have a position or you will somehow miss a move.
- Being obsessed with a particular market can cause you to miss good opportunities in other markets.
- Being obsessed with a particular market can force you start monitor-watching. Monitor-watching will play on your emotions and force you out of good decision making skills.
Sixth, markets go when they are ready to go, not a second sooner. The stock market will resolve itself at some point. I really thought yesterday was going to be a resolving day. It was not. So be it. There was a day in the futures markets when a strong move intraday had follow through. This was when there were pit exchanges and pit brokers and before the day of mean reversion HFT trading operations. Intraday thrusts can no longer be trusted within a trading range.
In the meanwhile predetermine a day in advance what your game play will be. Using market orders or tight limit orders within a trading range is a good indicator you are making a bad judgment. Avoid selling weakness and buying strength within a range. Keep your powder dry. Be patient.


0 comments:
Post a Comment