13 December 2011

Why I’d Steer Clear of Emerging Markets


Why I’d Steer Clear of Emerging Markets… For Now


While stocks continue to float on ether and pipedreams, the commodities, credit, and bond markets are all forecasting another round of deflation. Whether it arrives now or in the near future remains to be seen. But he fact remains that at some point we’re going to have another 2008 event. The most likely cause will be Europe, but with the Middle East heating up, and Bernanke’s loose money policies becoming more and more politically toxic in the US, who knows?

On that note, I expect emerging markets to underperform US indexes going forward. One chart I use to view how these two assets perform relative to one another is to price the Emerging Markets ETF (EEM) via the S&P 500. When this chart rallies, Emerging Markets outperform the S&P 500. When this chart falls, the S&P 500 outperforms Emerging Markets.


As you can see, since August, the S&P 500 has outperformed Emerging Markets with the exception of a few brief periods. I expect this trend to continue with US markets holding up better than their Emerging Market counterparts as we’ve recently broken major support.

Indeed, the long-term chart of EEM relative to the S&P 500 shows that the love affair with Emerging Markets may indeed be ending:


As you can see, we’ve broken below MAJOR support here and have since failed to reclaim this line (indicating that former support is now resistance). This is a VERY bearish chart which indicates that we are very likely entering a prolonged period in which Emerging Markets will underperform US indexes dramatically.

Prepare accordingly.

03 December 2011

Nifty : Triple Zig - Zag ?

The recent Nifty moves must have fooled many traders : the intraday breakdown of 4700, but the inability to close below it on the daily chart pointed towards a possibility of a strong upward reaction. We got that as well, can't say how many traders would have caught that move.

Next thought that comes in mind is how much more this rally can carry on, or have we made a short/medium term bottom. I took a look at the kind of pattern that has developed since last year, which in Elliot terminology looks like the formation of a triple zig-zag.


In the above table, I have marked the waves as A, B, C and X. Zig-Zag type of correction generally tend to have a relationship among its counterpart waves. As we see the first 2 wave Bs are around 75% retracement of wave As, also wave Cs are roughly 150% extension of wave A. The lower table shows wave Xs being about 60% retracement of the entire 3 wave correction.

The bottom 2 rows of the upper table is where I have tried to use this relationship to estimate the target of the current upward wave and the target of the next final C wave down. So the target of current rally looks to be ending around 5200 (nice resistance!) and finally a break of all supports to reach somewhere around 4100 (this is currently a vague target, underlying thought being another 1000 point or more massive fall).

The reason I am still suspecting another fall is the fact that we are still awaiting a resolution of all these European s***. The fact that all central banks come together to provide liquidity means there was something very terrible about to happen. The current effort is just another kick on the can. I am expecting market to realize sooner than later the hopeless situation Europe is in and the solution lies in taking the pain rather than buying another dose of the same drug.

The rally is also very technical in nature due to the fact markets was oversold and seasonal factors suggests some kind of year end Santa Claus rally! I feel we are going to make another top in late december or early january and then have a terrible Q1 2012. Hopefully 4000 or roundabout Nifty should find its feet.

26 November 2011

Longer Term View : Ichimoku Dependent!

Some time ago, I posted a weekly chart, requesting all my readers to exit out of equities because something happened in the charts which was signalling the end of bull market which started from October 2008. Which meant all rallies should be now sold into. That happened in January of this year, when Nifty after making its first lower high, formed a bearish engulfing candlestick pattern. Subsequently Nifty gave a sell signal on the Ichimoku Cloud as well. Since then Nifty has made a series of lower highs and lower lows.


This week it has broken the 200 week moving average, another confirmatory signal, which the long term players should beware of. Investing now, and giving valuation as a reason, would be foolhardy. The above chart shows how Nifty took some support at the 200 week moving average, and also gave a buy signal in October but the rally soon fizzled out and since it broke the 4700 support, another round of heavy selling could be expected even if there is some relief rally.

I wanted to point out, in this post the beauty of Ichimoku cloud which did not give any sort of buy signal, even though there were strong rallies from February to April and then in October. Ichimoku still believes that the trend is down and because its below the cloud expecting any kind of immediate support would be stupid.

I would like to point out that the monthly charts shows 4000 as support area.


Technically from an investing point of view, I will until there is a higher low formed on the charts and Ichimoku buy signal.

Could Not Resist Re-Posting It !


Happy Thanksgiving — the Dow could be going to 4,000


I hate to be the turkey of the day/month/year, but we are in a bear market. The only question is how low will this turkey go?
I am a chartist. I deal in chart patterns. I deal in possibilities, not probabilities and certainly not in certainties. I can only state what a chart is telling me by its geometric construction — and geometric patterns, even when clearly identified, are subject to failure.
Nevertheless, I am obligated to call a chart for what it is. Part of chart analysis is determining the price targets implied in a certain chart patterns. I get loads of criticism on this one. Whenever I state an implied objective of a pattern I hear the same whine:
“But, but, but,but, Brandt, you say in your book that charts are a trading tool and not to be used for price forecasting. Yet, Brandt, you make price forecasts. You are confusing me. You say charts should not be used for making price forecasts, but that is exactly what you are doing.”
If you are in this camp, I have one thing to say to you –  get over it, learn to live with it.
Charts are NOT for price forecasting. But a chart pattern carries an implied price move. I recognize that any given chart pattern has a significant chance of failure. But until a pattern fails or is not modified by a contrary pattern, then price targets are a good guideline.
When prices act contrary to the implications of a chart, then I run for the hills. But until then, I retain strong opinions (weakly held). If you can’t understand this nuance, that is your problem, not mine.
OK, all this was a build up to your Thanksgiving gift — a price forecast in the DJIA. Please step back and take a 30,000 foot view with me.
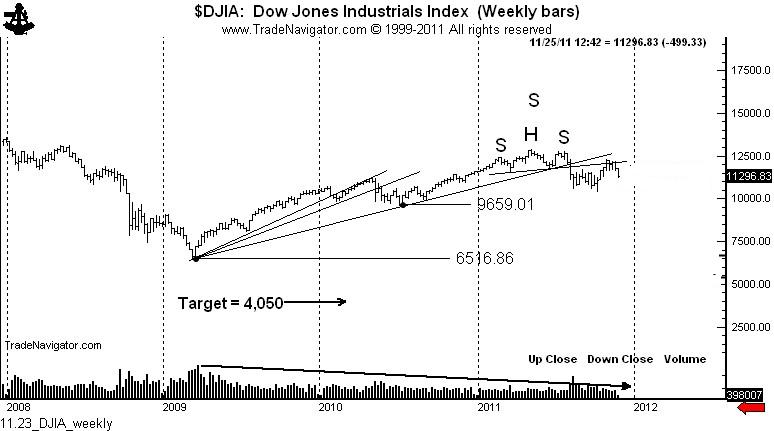
The rally from the March 2009 low was on decreasing volume. Rallies that do not draw in the public are very suspect, and prove more often than not to be corrective rallies. In this case, the correction is of the 2008 to 2009 price decline. That’s right, the volume profile of the this 32-month rally is much more typical of a bear market rally than of a genuine bull trend.
The founders of classical charting  (Schabacker, Edwards, Magee) identified something called a 3-fan principle. The 3-fan principle specifies that a corrective rally may be defined by trendlines with decreasing angles of attack. The concept also specifies that the violation of the third fan line establishes the top  of the corrective rally — and that the subsequent decline will retrace the entire distance of the corrective rally.
Now, you may want to give me with all the reasons why a return to the 2009 low is not possible. That’s fine — but, keep it to yourself. I will change my mind when price makes me change my mind, not one moment before.
The fact that the daily and weekly charts completed a H&S top simultaneously with the violation of the third fan line is a confirmation that the May and July highs will not be breached. Another classical charting principle is that H&S tops and bottoms (when they meet all of the criteria for the pattern, which this H&S top did do) represent a major turning point in a trend.
Next, let’s move from a 30,000-foot view to a perspective from the space station. Should the implications of the 3-fan principle be realized, something very, very, very (do I need to repeat the word “very” again?) significant would become apparent to a chartist.
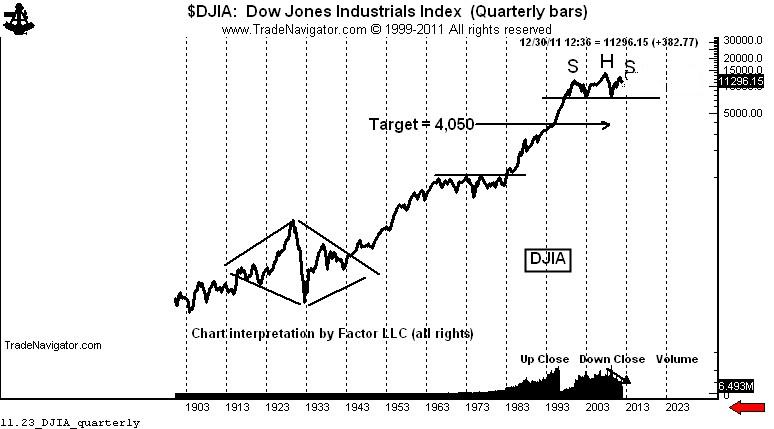
A move back to the 2009 low on the quarterly semi-log chart sets up the possibility (not probability, not certainty) of a 13-year H&S top whereby the entire advance from the March 2009 low is nothing more than the right shoulder of this massive configuration.
Should the market decline toward the 2009 low, then the massive H&S top on the quarterly chart becomes a real (but wild) possibility. The rules of classical charting specify that a decisive completion of a H&S top should lead to a decline equal to the height of the H&S.
On an arithmetic basis, the target in the Dow would become lower than 1,000. On the semi-long chart the target would be around 4,000. So I will use the higher target.
Do I really think the DJIA will decline to 4,000? I have no idea. But I do know this — that if it does it will be one wild (and hopefully profitable) ride.