Happy Thanksgiving — the Dow could be going to 4,000

I hate to be the turkey of the day/month/year, but we are in a bear market. The only question is how low will this turkey go?
I am a chartist. I deal in chart patterns. I deal in possibilities, not probabilities and certainly not in certainties. I can only state what a chart is telling me by its geometric construction — and geometric patterns, even when clearly identified, are subject to failure.
Nevertheless, I am obligated to call a chart for what it is. Part of chart analysis is determining the price targets implied in a certain chart patterns. I get loads of criticism on this one. Whenever I state an implied objective of a pattern I hear the same whine:
“But, but, but,but, Brandt, you say in your book that charts are a trading tool and not to be used for price forecasting. Yet, Brandt, you make price forecasts. You are confusing me. You say charts should not be used for making price forecasts, but that is exactly what you are doing.”If you are in this camp, I have one thing to say to you – get over it, learn to live with it.
Charts are NOT for price forecasting. But a chart pattern carries an implied price move. I recognize that any given chart pattern has a significant chance of failure. But until a pattern fails or is not modified by a contrary pattern, then price targets are a good guideline.
When prices act contrary to the implications of a chart, then I run for the hills. But until then, I retain strong opinions (weakly held). If you can’t understand this nuance, that is your problem, not mine.
OK, all this was a build up to your Thanksgiving gift — a price forecast in the DJIA. Please step back and take a 30,000 foot view with me.
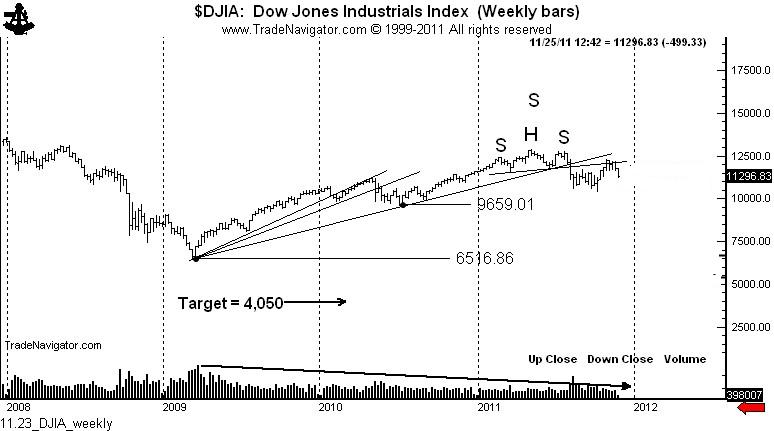
The rally from the March 2009 low was on decreasing volume. Rallies that do not draw in the public are very suspect, and prove more often than not to be corrective rallies. In this case, the correction is of the 2008 to 2009 price decline. That’s right, the volume profile of the this 32-month rally is much more typical of a bear market rally than of a genuine bull trend.
The founders of classical charting (Schabacker, Edwards, Magee) identified something called a 3-fan principle. The 3-fan principle specifies that a corrective rally may be defined by trendlines with decreasing angles of attack. The concept also specifies that the violation of the third fan line establishes the top of the corrective rally — and that the subsequent decline will retrace the entire distance of the corrective rally.
Now, you may want to give me with all the reasons why a return to the 2009 low is not possible. That’s fine — but, keep it to yourself. I will change my mind when price makes me change my mind, not one moment before.
The fact that the daily and weekly charts completed a H&S top simultaneously with the violation of the third fan line is a confirmation that the May and July highs will not be breached. Another classical charting principle is that H&S tops and bottoms (when they meet all of the criteria for the pattern, which this H&S top did do) represent a major turning point in a trend.
Next, let’s move from a 30,000-foot view to a perspective from the space station. Should the implications of the 3-fan principle be realized, something very, very, very (do I need to repeat the word “very” again?) significant would become apparent to a chartist.
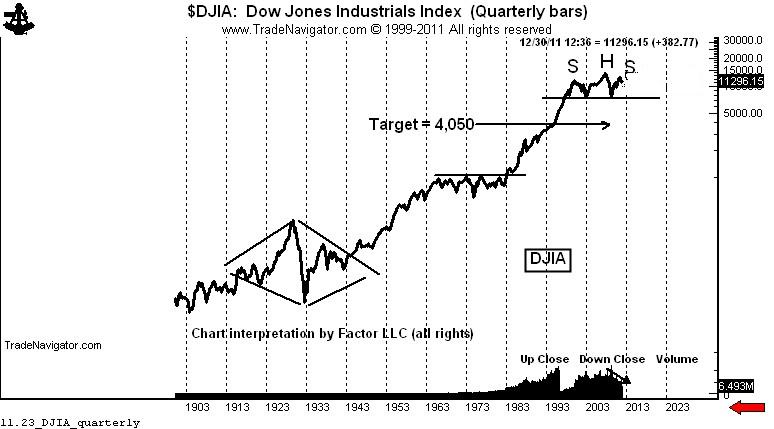
A move back to the 2009 low on the quarterly semi-log chart sets up the possibility (not probability, not certainty) of a 13-year H&S top whereby the entire advance from the March 2009 low is nothing more than the right shoulder of this massive configuration.
Should the market decline toward the 2009 low, then the massive H&S top on the quarterly chart becomes a real (but wild) possibility. The rules of classical charting specify that a decisive completion of a H&S top should lead to a decline equal to the height of the H&S.
On an arithmetic basis, the target in the Dow would become lower than 1,000. On the semi-long chart the target would be around 4,000. So I will use the higher target.
Do I really think the DJIA will decline to 4,000? I have no idea. But I do know this — that if it does it will be one wild (and hopefully profitable) ride.


0 comments:
Post a Comment