- Posted by JC Parets
- on June 23rd, 2011
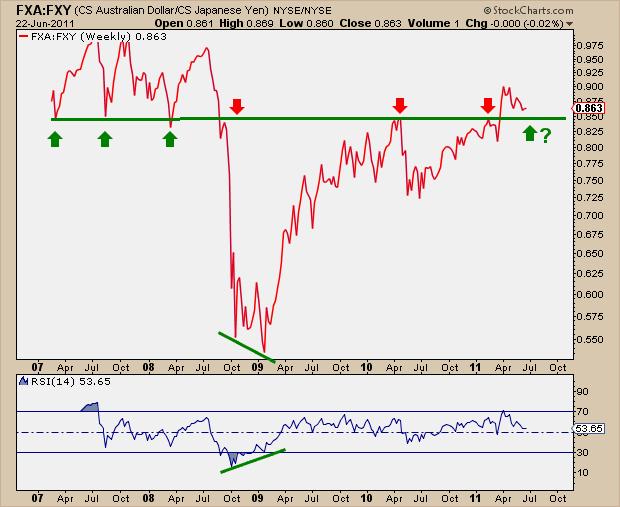
Exactly one month ago I put up a chart of the Australian Dollar vs the Japanese Yen ETFs ($FXA:$FXY). When looking at this ratio with the S&P500 behind it we can see the positive correlation immediately. When the Risk-On trade is dominating trading desks around the world, money flows into the Aussie Dollar and out of the Yen. When the Risk-Off trade is on then the opposite is true. I wanted to put up an updated chart of this ratio in order to show how critical of a level we are currently testing:

What was clear support throughout 2007 ultimately broke down with everything else in 2008. This same exact support level became Resistance on the way up in 2010 and again earlier this year. The $FXA:$FXY ratio broke out in the spring and is currently testing this key area. A successful test here should bode well for US Equities, while a breakdown would signal that this move was false giving us a heads up that the Risk-Off trade will be dominating the markets until further notice.

0 comments:
Post a Comment