The USD-INR weekly chart shown above is from March 2007 till date. Notice how Rupee strengthened till Oct-Nov of that year till 39 but then stabilized while the Nifty kept rallying. Even in January when the mini crash occurred it was well under 40. I personally cannot imagine such a crash in Nifty now without giving the exchange rate any resulting shock. Even a 100 point Nifty movement is accompanied with 30-50 basis points of movement in the exchange rate. How can an 1800 movement point be almost lost in the above chart? In my opinion the stock market and currency game were played in two different fields, also I cannot rule out RBI trying to stabilize the currency by intervening to give some respite to the exporters around that 40 levels before the mini crash in Jan and doing the opposite after it. (As it would have pledged to keep the exchange rate around 40).
But as we know that stock market mini crash was just the beginning and slowly and steadily global risk aversion was developing. After May 2008 Rupee started sliding as FIIs started selling their holding in India and other emerging markets which were considered risky assets as compared to US treasuries. This "sell" emerging market assets gained big momentum around Oct 2008 when Lehmann collapsed. Interestingly though Nifty made its low during this period, the carnage in broader market was still on. Which we see as the Rupee kept falling until it reached 52, almost a 33% fall in just over a year!
Then comes the phase where huge bailouts were announced and the Fed started printing dollars to save the US banks and much more (so dollar started losing value compared to other currencies). Apart from being highly oversold and shooting well below fair value, emerging assets also started looking attractive and since then we are still going strong with the rally in Rupee!
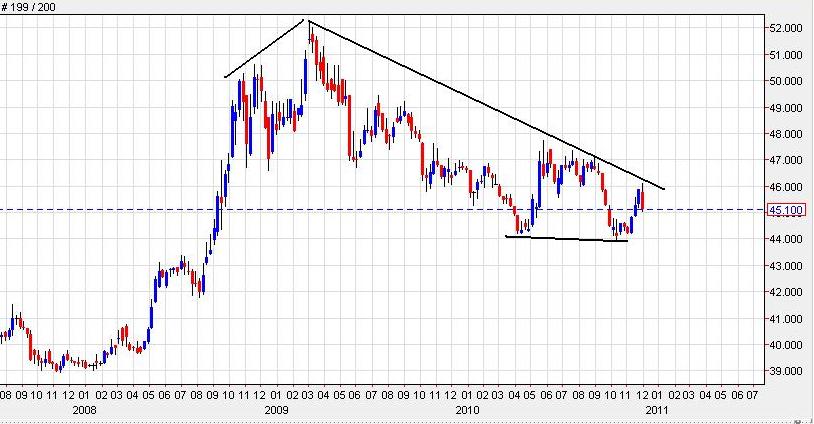
Now lets do some interpretation of this chart. The rally from 39 to 52 clearly looks to be a 5 wave. Also look at how rally from Dec 2008 to Mar 2009 forms a negative divergence, which is a very typical 5th wave property. Also note that the lows of Apr 2010 and Oct 2010 forms a positive divergence. Dollar also have rallied from 44 level, which interestingly is 62% Fibonacci retracement of the entire trend from 39 to 52.

If we look at the long term chart above we can clearly say it is in a long term uptrend. Which kind of makes me believe that the trend should continue. In the above chart see how from 2002-2003 dollar has lost its value while the stocks rallied from Nifty 1200 to 6300! Also note that it looks to be a 3 wave corrective pattern. Putting this in the back of mind I feel we are yet to see another strong rally in dollar compared to rupee which should take it above 52 to say the least.
Now all of know how this rally can impact stock markets. The fact that Rupee is going to weaken is not a concern, but the current structure of the currency market which blatantly says that dollar is a safe haven and emerging markets currencies are risky assets are. If this rally is to come, its going to be only on risk aversion, where all assets apart from Dollar will be painted with the same brush.
Another point to note on the first chart is that when Nifty was at 6300 in Jan 2008 Rupee was at 39, when Nifty was again at 6300 on Nov 2010 Rupee was at 44! Which means if I were a foreign investor and I invested at the top in Jan 2008 I am still net negative in dollar terms! Around 12.5% to put an estimate. And suppose I had invested in the broader market, I am sure I would be still down 50%! Somehow if the markets start to sell off again these guys would be the first to throw in their towel for hyperventilation as they will have to face the equity as well as rupee sell off double whammy !!

1 comments:
Hi Tariq,
Your posts are distinct in content & presentation.
Thanks.
Post a Comment